Cases of Covid-19 are trending back up globally and in the US. The world has nearly reached 10 million cases with over 2.3 million in the US. There is still a lot we don't understand about SARS-CoV-2 transmission but I am confident we are no where near herd immunity. Our model is consistently showing that the case ascertainment ratio, that is the ratio of official Covid-19 cases to total SARS-CoV-2 infections, is between 5 and 10. That means that the US has less than 25 million infections while the world is less than 100 million.
Herd immunity means that for any fixed reproduction number, R0, the number of active infections will trend downward if the fraction of the initially susceptible population falls below 1/R0, or the total number infected is higher than 1- 1/R0. Thus, for an R0 of 4, three quarters of the population needs to be infected to reach herd immunity. However, the total number that will eventually be infected, as I will show below, will be

which is considerably higher. Thus, mitigation efforts to reduce R0 will reduce the total number infected.
Some regions in Western Europe, East Asia, and even the US have managed to suppress R0 below 1 and cases are trending downward. In the absence of reintroduction of SARS-CoV-2 carriers, Covid-19 can be eliminated in these regions. However, as the recent spikes in China, South Korea, and Australia have shown, this requires continual vigilance. As long as any person remains infected in the world, there is always a chance of re-emergence. As long as new cases are increasing or plateauing, R0 remains above 1. As I mentioned before, plateauing is not a natural feature of the epidemic prediction models, which generally either go up or go down. Plateauing requires either continuous adjustment of R0 through feedback or propagation through the population as a wave front, like a lawn mower cutting grass. The latter is what is actually going on from what we are seeing. Regions seem to rise and fall in succession. As one region reaches a peak and goes down either through mitigation or rapid spread of SARS-CoV-2, Covid-19 takes hold in another. We saw China and East Asia rise and fall, then Italy, then the rest of Western Europe, then New York and New Jersey, and so forth in series, not in parallel. Now it is spreading throughout the rest of the USA, South America, and Eastern Europe. Africa has been spared so far but it is probably next as it is beginning to explode in South Africa.
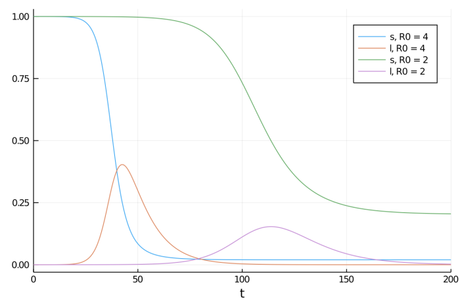
A reduction in R0 also delays the time to reach the peak. As a simple example, consider the standard SIR model


where


We see that halving R0, basically doubles the time to reach the peak but much more than doubles the number of people that never get infected. We can see why this is true by analyzing the equations. Dividing the two SIR equations gives

which integrates to


where


If we assume that


This is the fraction of the population that never gets infected, which is also the probability that you won't be infected. It gets smaller as


To figure out how long it takes to reach the peak, we substitute equation (*) into the SIR equation for


We compute the time to peak,


We can't do this integral but if we set


where


which is integrated to

If we assume that


So,


NB: Typos in equations in original have been fixed
