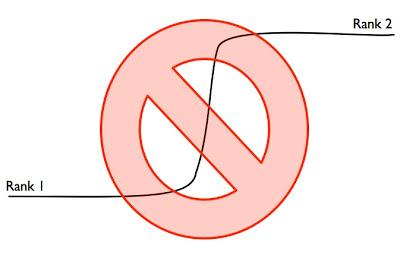
In section 2.2.1, “Growth Curves”, Hays makes the point that growth curves would not be abrupt like this:

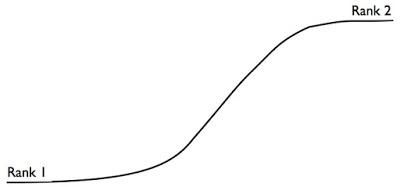
Rather, they would be like this:

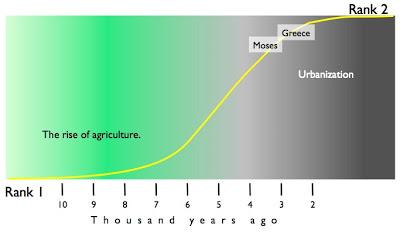
Hays diagrammed the transition from Rank 1 to Rank 2 like this:

As Hays presents it, this curve is basically a visual metaphor. Would it be possible to construct such a curve using real quantitative data? The answer is “yes”, though no one has yet done so in a serious way.
But, in a different book, Hays has given us an indication of that. In the last half of the previous century there was an extensive literature devoted to the measure of cultural complexity, mostly in preliterate cultures. Scales of complexity were developed using such things as measures for division of labor (how many different occupational specialties?), scale of settlement (size of largest settlement), social ramification (hierarchical levels of organization), and counts of occupational specialization. Hays undertook a review and synthesis of this literature in the mid-1990s and in an appendix he presents a couple of growth curves from Rank 1 to Rank 2 [2]. Regarding the first of these curves, Hays recommends caution:
The superimposed curve is a standard growth curve, an ogive, fitted by eye through trial and error. With only ten data, the use of any mathematics would be pretentious, but if twenty or a hundred more units from Mediterranean antiquity were scored, a best fit could be calculated. Without a meaningful basis for the scores, such a diagram would be speculation, or mere nonsense. But the scores used here have a tight linear relationship with Naroll's Team count; the curve is, among other things, a curve of growth in the apparatus of governance.
There is much work to be done.
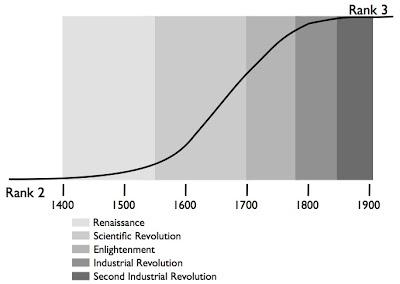
Hays provides a curve for the growth from Rank 2 to Rank 3 in an appendix to Chapter 4, “Informatics”:

Hays did not hazard a curve for the transition from Rank 3 to Rank 4, presumably because Rank 4 is happening all around us. We are too close to see it [5].
References
[1] David G. Hays, The Evolution of Technology Through Four Cognitive Ranks, Metagram Press, 1995, http://asweknowit.ca/evcult/Tech/FRONT.shtml.
[2] David G. Hays, The Measurement of Cultural Evolution in the Non-Literate World, Metagram Press, 1998, pp. 257 ff., https://www.academia.edu/37163326/The_Measurement_of_Cultural_Evolution_in_the_Non-Literate_World.
[3] As an example of the work currently being done see, e.g., Peter Turchin, “Quantitative historical analysis uncovers a single dimension of complexity that structures global variation in human social organization”, PNAS, January 9, 2018 115 (2) E144-E151; first published December 21, 2017 https://doi.org/10.1073/pnas.1708800115.
[4] See section 4, “In Medias Res: The Current Flux”, of William Benzon and David Hays, The Evolution of Cognition, Journal of Social and Biological Structures 13(4): 297-320, 1990, https://www.academia.edu/243486/The_Evolution_of_Cognition.

