I have introduced many practical online charting tools before, but some of them are outdated and cannot be used. Through the browser, various charts showing data can be quickly created online. Compared with giving a whole text description, it is expressed in the form of charts It is faster, clearer and easier to understand. Generally speaking, it is not too difficult to make charts with document editing software. If you want to make charts and pictures for web pages, you may need the assistance of other tools. The most convenient is still the online tool. Open the browse Converter, import relevant values to quickly generate pictures, and generate links when needed, so that others can browse the charts.
This article will introduce " Graphy "is a free online chart creation tool. Users can set various data to be displayed on the web page and turn it into a beautiful chart presentation. It supports bar charts, stacked bar charts, line charts, pie charts, and sweet charts. Circle chart and funnel chart, you can also customize the color and style of each part of the chart, four different picture sizes: vertical, square, horizontal and super wide, and export it as PNG picture format or hyperlink after production.
The advantage of Graphy is that there is no need to download or install additional software, and Chinese can also be used in the charts. The generated pictures will not have garbled characters or problems that cannot be displayed, and there is no need to register or log in to the account when using various functions. You will be required to register when creating a sharing link, but there is no additional charge for these operations. Generally speaking, there are all the options you should have, and the interface design is very simple. You can get started with a little exploration!
If you need to make a chart, I also introduced the following tools:
use teaching
STEP 1
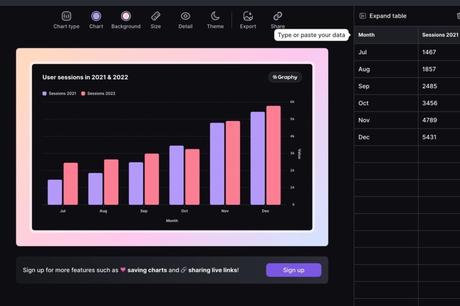
After opening the Graphy website, you will see a default chart. There are data samples in the data column on the right. You can switch between different chart types from the "Chart type" at the top. After clicking, it will be quickly applied to the current chart editor preview. Try it out Various graph types provided by Graphy.
Here is a small reminder, if you will use the function of generating chart links, remember to click "Share" above and register an account before starting to set the data (login directly with a Google account when registering), otherwise after making the chart Re-registration information will disappear and need to be re-entered.
STEP 2
On the right side of the website is the sample data provided by Graphy. Expand the table and click "Clear table" in the upper right corner to clear the data, and then you can add the data to be made into a chart. It is a pity that there is no function of importing files, and the data needs to be entered manually , it will be very time-consuming when the content is large.
STEP 3
In addition to switching between different chart types from the upper menu, there are also chart and background color replacement options. Although only the built-in color palette tool can be used, the colors look quite comfortable.
STEP 4
Switch between four different chart sizes from the menu "Size" option, including: portrait, square, landscape and extra wide. The vertical chart generation function is very suitable for use on mobile devices.
STEP 5
When everything is ready, don't forget to modify the title above the chart. Just click and enter the text to be displayed and it will appear. The numbers or legends in the chart will be presented according to the data added by the user in step 2.
Graphy also has a setting theme switching mode, with light and dark colors, both of which look very clear and beautiful.
STEP 6
Finally, click "Export" in the upper right corner and then press "Download" to export the chart and save it as a PNG image format. There is also another option to copy to the clipboard. If you want to use it in other editing software, just paste it to get the image .
Another sharing option "Share" was mentioned earlier, which can generate the user's chart as a hyperlink, but it can only be used after registration and login. It is best to register an account before making a chart at the beginning, so as to avoid Registration may cause the previously imported data to disappear.
The picture below is an example of a chart quickly made using Graphy. Friends who need to create a beautiful chart can study it.
Three reasons why it's worth a try:
- Free and convenient online chart making tool, only need a browser to quickly generate various data charts
- Various chart types are supported, including bar charts, stacked bar charts, line charts, pie charts, donut charts, and funnel charts
- Provide four different image sizes, export the created chart as a PNG image format or generate a hyperlink
產生器類,線上工具,可視化工具,圓餅圖,圖表繪製,圖表製作,條形圖,產生器,簡報設計,統計分析數據,統計圖表,網頁工具,視覺化,資料分析,資訊圖表
#Graphy #free #online #charting #tool #supports #multiple #data #presentation #methods

