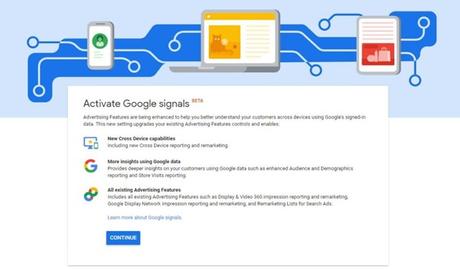
What is Google Signal?
A key feature of the new feature for data collection and retrieval is that users have turned on ad personalization settings, thus allowing Google to use their information to personalize ads.
Google Signal is a new Google Analytics Cross Device report, similar to the User-ID report.
In this case, Google Analytics tracks meetings and device type for all users who have logged in to their Google Accounts and converted. After activating this feature, Google Analytics is able to select the device from which the first click was made, other devices from which various clicks are made in the path of the customer, and finally the device that leads to the conversion. Recognize.
Let’s look at an example : the user clicks the first ad on the smartphone, then clicks on the second ad on the tablet, and finally completes the conversion on the desktop (Mobile> Tablet> Desktop). You can now get an overview of the interactions between users’ devices and how they reach the final conversion. This feature helps a lot in improving re-marketing and reporting.

How to enable Google Signals ?
To activate Google Signal, you should see a blue banner above your account name, which you can see in the image below.
After clicking “Get started” you will be taken to a new page in Google Analytics where you will be asked if you want to enable Google Signals for all account features, for that feature or for specific features. Clicking “Activate” will take you to the “Analytics” section of Google Analytics, where you can check if the “Datasets for Google Signals” option is checked.
How to enable Google Signals?
What reports does Google Signal provide?
On the left, under the Contact tab, you will find a new report called Cross Device. Let’s see what kind of report is included.
Device overlap
Similar to the device cross-report via User-ID view, this new report gives you a better understanding of the overlap of the devices that users have used to interact with and convert the site.
Device path
This report shows the sequence of devices that users have used in the conversion path.
For example, [Desktop]> [Mobile] indicates that users are involved with your content, first from a desktop device and then from a mobile device.
A filter is available for routing. Through the filter you can see the whole conversion path (all steps in the path), before (before steps) and / or after (after conversion).
Routing helps to understand the user’s journey before, during, and after the start of a goal, event, or page view. Exit Intent event.
channels
Report data is indirect based on the last click assignment model. This report identifies the channels that lead to conversion based on common metrics of acquisition, behavior, and conversion.
Absorption device
This report shows the key devices used by users to interact with the site or conversion. This is interesting because you can see that the amount of revenue is broken down by acquisition compared to other devices, which is a kind of attribution model.

What reports does Google Signal provide?
Limitations
Currently as Google Signal in beta
You can not apply sections to inter-device reports
Limit of 250,000 sessions (for the selected data range) before sampling
Google Data Studio, Big Query, i Custom Report / Tables, and User-ID views are not supported and therefore cannot use the data collected by Google Signal.
What is the use of such data?
Customer trip optimization depending on the device used by users
Strengthen remarketing by targeting specific categories of users / devices
- Increase device cross-link advertising
- Finally SEO growth
- Get Targeted web traffic that converts
The post Google Signals New Analytics Feature first appeared on * Web Traffic Booster.
