The next step in making the most of Google Analytics is to look at the default reporting offered by GA itself. Over the next few articles we will look to understand each of the main tabs; Audience, Acquisition, Behaviour and Conversion.
What is in the Audience Report?
There are 3 distinct sections to the Audience Reports: Who your audience are (Demographics), How they consume your content (Technology) and How loyal & engaged your audience are (Behaviour).
Why this Audience & Demographic Data is Important
To help us understand how to use this data it is important that we know why it can be useful to website owners and website developers such that we can improve our offerings.
Note: Enabling Demographics is Easy, simply Click Admin, under Property Click Property Settings and toggle On Demographics.

Demographics & Interests – Age, Gender, Affinity Groups & Market Segments
Understanding the composition of your audience gives you and advantage over your competitors, it means that you can tailor your content, products, services and advertising directly to your audience – this can be anything from language used, graphics displayed to how you advertise away from your own website.

Knowing the Interest Groupings of your audience has similar “power”. By knowing what affinity group and market segments and audience member may belong to allows you to target your content even more precisely – it allows you to increase hugely the likelihood of someone consuming your content or buying your product.
Learn about How Google Determines Demographics
Technology – Browser, Network, Device etc
All website audiences are different, they not only belong to a different variation of demographics but also (and sometimes more importantly) interact with the website in a different way due to the technologies they use to visit the website.
Google Analytics allows you to get to grips with key technology data, such as which web browser someone is using (Chrome, IE 9 etc), the operating system a user is visiting from (iOS, Windows Vista etc), the Device in use (mobile, tablet, desktop) and the Network from which they visited (Broadband, 3G, 4G etc).
This data allows you to shape your website and how it acts – for example if 45% of your visitors come from a mobile device you would want to look at ensuring you offered a great mobile experience which loaded quickly (even on 3G mobile networks).
Behaviour – New & Returning, Frequency, Engagement
A key metric of many websites, such as SEOAndy, is how often someone returns to the website and how engaged those users are with the site and content. This is known as a gravitational pull of a website and allows you to see the impact on business of a new vs returning user etc.

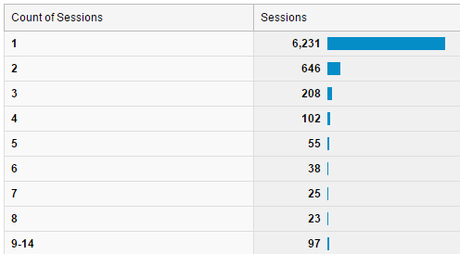
This data is also good for enabling you to measure just how loyal your audience is to your site, for example in the chart above (from a client) you can see that they have a number of visitors who return multiple times in the given period. This is great news for the website, especially if the data is being combined with other data points to ensure these visits convert.
Location Location & Language
Location and Language can be very important to any website. Knowing that your are targeting the right audience in the right location is important
The best example of this is for ecommerce websites that can only serve a single region, nation or other geographic boundary. Many ecommerce websites in the UK won’t ship abroad and so if they found 80% of traffic was non-UK they may want to look into that as a further option of growth, or more-likely look at how to improve the content such that the UK became the main audience.
User Flow – A Powerful Tool
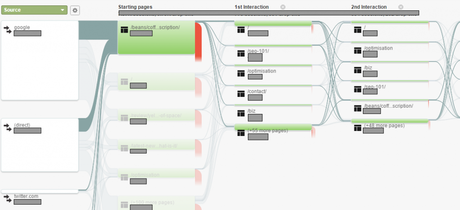
One of the lesser known tools of Google Analytics is the User Flow tool, it allows you interrogate the path a user followed through your website based on various start points, including: Country, City, Browser, Landing Page, Campaign Source, Traffic Type etc.

With this type of data you can begin to view your high drop-off points of the website and examine what more you can do to ensure users stay within your website and move to the pages you want them to visit.
Take Action:
Today I want you to visit your Analytics, ensure you have Demographics enabled and then explore the data from each section. What did you find that you didn’t expect to see?
Original SEO Content by SEOAndy @ Google Analytics – Audience & Demographics Reports

