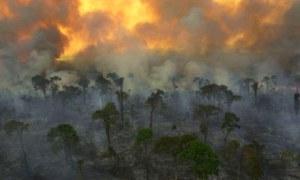
 These interactive maps show carbon emissions associated with clearing of above ground live woody biomass across the tropics. You can use the map layers to create custom maps of forest change, cover, and use. This is a great resource! Recommended.

“At this time, GFW Climate focuses only on estimating emissions from tropical deforestation, and does not include emissions or removals from other land use activities such as forest degradation or carbon stock enhancements from forest gains. Methods and data for these activities are generally less developed than those for deforestation. Given the recent momentum behind global and regional restoration initiatives, future versions of GFW Climate may expand to include other activities as new data become available.
“GFW Climate is supported by a diverse partnership of organizations that contribute data, technology, funding, and expertise. The GFW partnership is convened by the World Resources Institute. See a full list of partners below.” —Global Forest Watch.

