We are told that water vapour is a greenhouse gas for the same reasons as CO2, i.e. it can absorb and re-emit infra red radiation. We can't arbitrarily vary CO2 levels, but absolute humidity can be anything between zero and thirty-thousand mg/l (cold, dry days v warm, humid days). So the amount by which temperatures fall after dusk should be inversely proportional to absolute humidity (i.e. the insulating 'greenhouse effect' should be proportional to absolute humidity).
-----------------------------------------------
So we could produce strong evidence to support or contradict the MMGW theory quite easily and relatively cheaply, as follows:
Set up measuring devices, which record the following variables:
- temperature at dusk,
- temperature six hours later (or slightly shorter than the shortest night at that latitude),
- absolute humidity (milligrams H20 vapour per liter of air),
- cloudiness, and
- windspeed.
Ideally you'd do measurements at many different locations, the more readings you have the better. And ideally, you'd have three sets of measuring devices at each location - one at the bottom of a tall structure like a TV mast, one half-way up and one at the top, and average the three readings for each variable.
At the end of (say) one year, you:
- filter out the 'cloudy' nights. We know that clouds warm things up at night, but clouds are not water vapour (gas), they are water droplets (liquid) or ice (solid) and clouds have a quite different and much stronger effect than water vapour. Maybe you can measure 'cloudiness' by using a telescope to see what percentage of stars are clearly visible, in which case you filter out measurements for nights where fewer than (say) 95% of stars were visible for at least 95% of the time?
- filter out the 'windy' nights, because the air blowing in might be warmer or colder than the air at that location at dusk, so they could be entirely random results.
-----------------------------------------------
Having done your readings and filtered out cloudy and windy nights, you interpret the results:
1. Calculate the average fall in temperature over the six hours after dusk on the most humid (but cloud-free nights) when absolute humidity was high, (say) 20,000 mg/l, and set this as the baseline level.
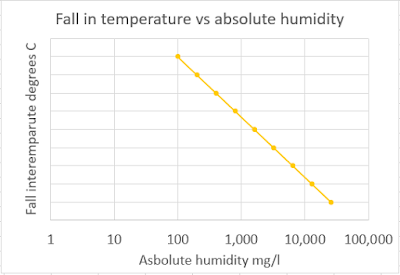
2. IF the MMGW theory is correct, and the relationship is logarithmic, for every doubling in mg/l the fall in temperature will be X* smaller (insulating effect). So at 10,000 mg/l the fall in temperature should be X* more than the 20,000 mg/l baseline, and so on. On very dry (and cloud-free) nights with only 312.5 mg/l, the fall in temperature should be 6X* more than the baseline.
So you would get a chart that looks like this with a fairly steep gradient and strong correlation:

3. IF the MMGW theory is incorrect, the gradient will be very flat and there will only a weak correlation.
NB - One mg/l is approx. equal to one part per million by volume. We can adjust this to the true value for ease of comparison with CO2 levels, which are expressed in ppm.
* I have not shown the scale on the x-axis because I have no idea what the baseline will be or what the gradient will be - that is what the experiment is supposed to find out. I do not know whether the insulating effect "X" will be 0.1C, or 1C, or 10C for every doubling of absolute humidity. I believe that H20 is considered to be a far stronger 'greenhouse gas' than CO2 as it can absorb and re-emit infra red at far more wavelengths, I think about ten times as many, but don't quote me on that. Clever scientists can work backwards from the findings to establish what sort of insulating effect (aka 'greenhouse effect') there would be if CO2 levels double from 'pre-industrial levels' of 300 ppm to 600 ppm.
------------------------------------------------
Personally, I expect that the result will be within the margin of error of the calculations, but I'm open-minded about all this. You don't do experiments to 'prove' or 'disprove' things, you do the measurements and then interpret them as honestly as possible.
------------------------------------------------
The bonus here is that you can do a similar plot of fall in temperature vs cloudiness, with clear nights on the left and cloudy nights on the right. I expect that this will show a very strong correlation and a steep gradient. But I'm open minded on this as well. Then do a double regression analysis, where the insulating effect is some multiple of 'cloudiness' plus some multiple of mg/l. This will tell you how much stronger the insulating effects of clouds is compared to the insulating effect of water vapour. And so on.
