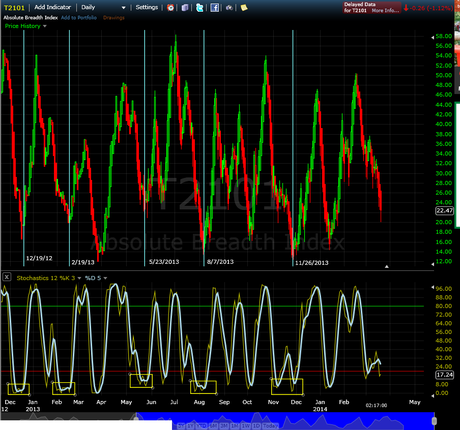
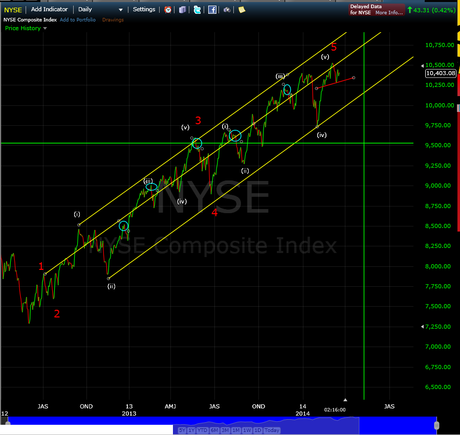
So far, I remain on the bearish side waiting for a low to be made into April, as we was indicated in the earlier post (link above). So I thought rather than stare at price and speculate about an unknowable future, I would study some indicators to see if I could find any edge. The price charts are muddy, but here is the best I could come up with on indicators, and it isn't bad.
First, that last 5 times during this up wave from 2012 that the Stochastic on the Absolute Breadth index have made a double bottom rather than just flowing back to the top are identified on the chart below by date: I have applied those dates to the NYSE chart, which holds the bearish master EW count. I have those dates identified with Cyan Blue Circles on the chart below:
 As you can see, each of those indicator setups produced down moves with some being larger and some smaller. 5 out of 5 is one hundred percent if my math is correct. Is this the time it will fail? I will assume that it will do what it did in the past and sell off. Accordingly, I am staying with the sell into April scenario.
I will continue to have limited availability to post on the blog and will largely be posting on Twitter. Happy Equinox! In this day. On this day in 1345, the Black Death was created from the "triple conjunction of Saturn, Jupiter and Mars in the 40th degree of Aquarius." March 20, History. I have not seen any of the professional TA guys posting 1345 chart Analogs, so hopefully we are in the clear. :-) If not, Boils!
There is always a bear path and a bull path. We cannot know which path our future will choose. As always, do your own due diligence, read the disclaimer, and make your own investment decisions.
Peace, Om,
SoulJester
