The price of ETH hasn’t been able to break above a key trendline resistance for a long time, and now Ethereum risks losing a lot of technical support as well.
Ether’s (ETH) rebound compared to Bitcoin’s (BTC) $22,743 drop shows signs of fatigue and risks breaking through a key technical support level.
In the second half of January, ETH is worth less than BTC.
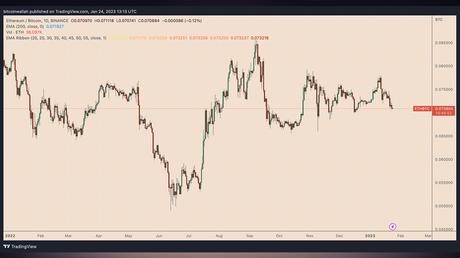
On January 24, the ETH/BTC pair fell about 9.25% from its local high of 0.0779 BTC on January 11. Since the beginning of the year, Bitcoin has grown 38 percent while Ether has grown 35 percent.

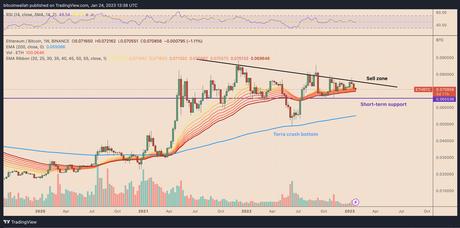
As shown below, Ether’s price has dropped to the bottom of its EMA ribbon range, which is an interesting thing to note.

The EMA ribbon indicator shows several exponential moving averages of increasing timeframe all on the same price chart. If an asset falls below the ribbon range, it’s more likely that it will keep falling.
The price of Ether is capped by a key trendline that shows prices going down.
This week, ETH/BTC fell to the 55-week exponential moving average (the red wave) on its EMA ribbon indicator, which shows a bottom wave. On January 24, buyers took control near the 55-week exponential moving average. This caused Ether to rise just 0.35% against Bitcoin, to 0.0708 BTC.
Now, however, there is a good chance that the EMA ribbon bottom will be tested again. This is because of a multi-month falling trendline resistance (the black line in the chart below), where selling has been getting more aggressive recently.

So, one can’t say for sure that ETH/BTC won’t drop below the EMA ribbon range, like it did in May 2022 after Terra crashed.
Then, compared to Bitcoin, Ether fell more than 25% to 0.0490, which was the same as its 200-week exponential moving average (the blue wave).
If a similar breakdown happens in the coming weeks, the ETH/BTC pair could test the 200-week exponential moving average (EMA) near 0.0550 BTC as its main downside target. This would be a price drop of nearly 20% from where it is now.
