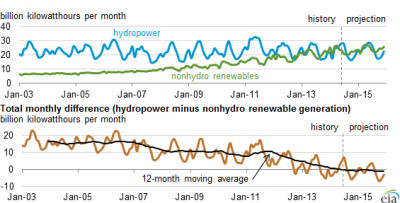
 Total monthly hydropower and honhydro renewable generation. (Source:
 U.S. Energy Information Administration, Electric Power Monthly and
Short-Term Energy Outlook)
April marked the eighth consecutive month that total monthly nonhydro renewable generation in the U.S. exceeded hydropower generation.
Only a decade ago, hydropower—the historically dominant source of renewable generation—accounted for three times as much generation in the United States as nonhydro renewable sources (wind, solar, biomass, geothermal, landfill gas, and municipal solid waste).
SEE ALSO: EIA: Hydropower Limited by Money, Not Resources
The recent growth in wind and solar, which reflects policies such as state renewable portfolio standards and federal tax credits as well as declining costs of technology, has been the primary driver in the increasing market share of nonhydro renewable generation. There also has been growth in geothermal and biomass sources.
October 2012 was the first month on record in which nonhydro renewable generation exceeded hydropower generation. Although this reversal was short-lived because of the significant month-to-month variation in both hydro and nonhydro resources, the trend lines began to cross each other more frequently in the past year, with the most recent reversal lasting from September 2013 through April 2014. While hydropower once again exceeded nonhydro renewable generation in May 2014 (the latest available data), EIA projects that 2014 will be the first year in which annual nonhydro renewable generation surpasses annual hydropower generation. By 2040, nonhydro renewables are projected to provide more than twice as much generation as hydropower in EIA’s Annual Energy Outlook 2014 (AEO2014) Reference case, as discussed in the AEO2014 Market Trends. In other AEO cases that assume the continuation of tax credits or other policies that support nonhydro renewables, their overall generation and generation share relative to hydropower is much higher.

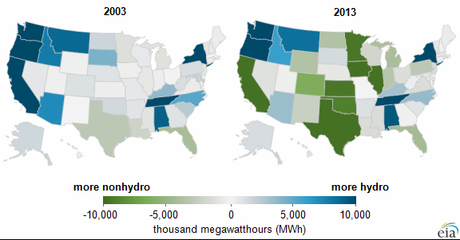
Difference between annual generation of hydro and nonhydro renewable sources by state. (Source: U.S. Energy Information Administration, Electricity data browser)
The dataset used to develop this article includes only generation from plants whose capacity exceeds 1 megawatt, and as a result does not include generation from most distributed solar PV capacity. Inclusion of distributed solar PV generation, which EIA estimates at roughly 10 billion kilowatthours in 2013, modestly accelerates the timing of the crossover between hydro and nonhydro renewable generation (see AEO2014).
Hydropower capacity has increased by slightly more than 1% over the past decade, although actual hydropower generation can vary noticeably by season depending on water supply conditions. Wind capacity, on the other hand, has increased nearly tenfold over that same period. Although wind often has lower capacity factors than hydropower, wind generation increased from 3% to more than 30% of total renewable generation between 2003 and 2013.
Hydropower does exceed nonhydro renewable generation in several states, particularly in the Northwest, where in 2013 conventional hydropower accounted for 69% and 56% of total electricity generation in Washington and Oregon, respectively. However, the market penetration of other renewables is growing in the United States, particularly in the Midwest and California. Between 2003 and 2013, the number of states for which nonhydro renewable generation exceeded hydropower generation, shaded green on the maps, nearly doubled—increasing from 17 to 33 over this period.

