- Date: March 9, 2016
- Posted by Litcom Team
- Category: Data Visualization

 Big data is generating unique opportunities for businesses to realize deeper, faster insights that can bolster decision making, enhance the customer experience, and quicken the pace of innovation. But today, most big data yields neither meaning nor value. Businesses are so overwhelmed by the amount and variety of data pouring into and through their operations that they grapple just to store the data—much less analyze, interpret, and present it in meaningful ways.
Visualization and Discovery
For assistance in this effort, organizations are increasingly turning to visualization-based data discovery tools. The tools promote self-service BI, allowing a multitude of users to easily integrate or “mash up” data from an extensive selection of sources— social media platforms, log files, videos, customer experiences and more. With BI tools, users can execute real-time, predictive analyses, and showcase the results in captivating, interactive, and easily understood visual presentations. The trend toward visualization-based data discovery tools is worth investigating by any organization that seeks to derive more value from big data. The potential business benefits are immense, and data governance best practices can be used to help ensure a safe transition.
Integrating Data
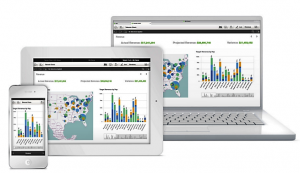
Data visualization software can tie directly into a variety of data sets, files and spreadsheets in real-time. Then, with just a few clicks of the mouse, a user can pull data from just about anywhere and have it represented in an interactive chart, table or dashboard. And, since the software allows users to interact with the data, managers can group, analyze, organize, and summarize data with speed and efficiency.
Data visualization gives key decision makers the ability to see patterns – such as sales trends, customer buying habits, production bottlenecks – and respond accordingly.
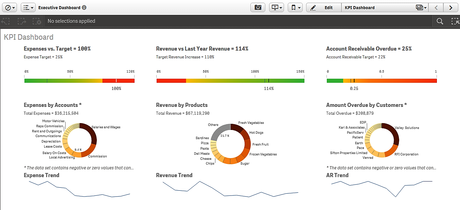
Qlik Sense Executive Dashboard Example
What can Data Visualization do for my organization?
Data visualization tools can assist clinics track physician and hospital performance; post-secondary schools assess student applications; e-commerce retailers comprehend what customers are doing before they buy, and to gather and analyze hundreds and thousands of data points to identify trends; financial securities firms gather, evaluate and interpret customer trading data; and much, much more.
Data visualization software places amazing data analysis capabilities into the hands of people throughout an organization, helping personnel to easily identify issues or concerns, identify efficiencies, and capture new opportunities – irrespective of the amount of data stored.
The Litcom Approach
Litcom is an official Qlik Partner. We help organizations turn a vast array of data into valuable information that drives decision-making in a corporation. Our solutions ensure that all data has clear definitions and a fully understandable presentation to users.
Data Visualization – Seeing is Believing
Litcom is offering a risk-free, no-cost opportunity for you to experience the power and benefit of Business Analytics and Data Visualization.
Litcom’s ‘See Is Believing’ (SIB) allows yo

After the completion of the SIB application you will have an evaluation period during which IT and business users can test and experience the power of Data Visualization first hand.
I am interested in a complimentary SIB
News Categories
- Business Analysis
- Data Visualization
- Enterprise Security
- ERP Optimization
- Information Security Health Check
- Information Security Program Development
- IT Assessment
- IT Management
- IT Staff Augmentation
- IT Strategy
- Merger & Acquisition Due Diligence
- PCI Compliance
- Post Merger Integration
- Procurement Process Improvement
- Project Management
- Threat Risk Assessment & Penetration Testing
- Vendor Selection
Archives
- March 2016
- February 2016
- January 2016
- December 2015
- November 2015
- October 2015
- September 2015
- August 2015
- July 2015
- June 2015
- May 2015
- April 2015
- March 2015
- February 2015
- January 2015
- December 2014
- November 2014
- October 2014
- August 2014
- July 2014
- June 2014
- May 2014
- March 2014
- February 2014
- October 2013
- June 2013
- May 2013
- April 2013
- March 2013
- February 2013
- January 2013
- December 2012
- November 2012
- October 2012
- September 2012
- August 2012
- July 2012
- June 2012
- May 2012
- April 2012
- March 2012
- June 2011
- May 2011
Stay Connected
265 Rimrock Rd., Suite 202
Toronto, Ontario M3J 3C6
phone: 905 763 8900
fax: 905 763 8233
email: [email protected]
Recent Posts
- Data Visualization: Deriving value from your organization’s big data
- IT Due Diligence in an M&A transaction
- Entering the Mind of a Modern CIO (Infographic)

