The New York Rangers' Henrik Lundqvist is the reigning 2012 Vezina Trophy winner, and a 2012 Hart Trophy finalist. He is not only one of the game's top goalies, he is also among the NHL's overall elite.
Carey Price has positioned himself among the league's top goalies, but has yet to enjoy the same level of success as Lundqvist.
The 6'1", 195 lbs. Lundqvist finished the 2012 regular season with a 39-18-5 record, a 1.97 goals against average, and a .930 save percentage. He has a career save percentage of .920 during the regular season, and .917 during the playoffs.
Price is the Montreal Canadiens undisputed number 1 goalie. The 6'3", 220 lbs left-handed shooting goalie finished the 2011-12 regular season with a 26-28-11 record, a 2.43 goals against average, and a .916 save percentage. He has a career save percentage of .916 during the regular season, and .907 during the playoffs.
The numbers included in these tables are based on five games of data for each goalie. Lundqvist's data was compiled during five 2012 NHL playoff games, while Price's data is from five 2012 NHL regular season games. Obviously, more data is necessary to help create more definitive ratings. But, for the purpose of this post I will work with the data I have, and continue to compile more data in the future.
Please note, this post is not a statement as to whether Price is as good as, or better than Lundqvist. It is simply a statistical comparison using my goaltender tracking system.
*An explanation of the system I use to rate goaltenders is available at the bottom of this page.
*The averages included here were compiled from 50+ goaltending scouting reports
SHORT-HANDED
NO REBOUND %
The average rate at which goaltenders scouted using this system have been able to avoid giving up any short-handed rebounds is 36%. Expressed differently, this means that 36% of short-handed shots faced by goaltenders were either deflected out of play or held for a whistle. As such, the higher the number, the better the rebound control.
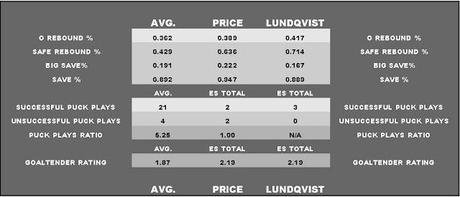
Both goalies have well above-average "no rebound" percentages. Henrik Lundqvist has a higher percentage than Price. Lundqvist deflected the puck out of play or froze 42% of the shots he faced short-handed, while Price did the same with 39% of shots.
SAFE REBOUND %
The average rate at which goaltenders were able to keep the rebounds they produced short-handed out of the slot was 43%. Expressed differently, this means that 43% of the short-handed rebounds produced by goaltenders landed outside of the slot. Again, the higher the number, the better the rebound control.
Lundqvist has a substantially higher "safe rebound" percentage than Price. Seventy-one percent of the rebounds he produced short-handed landed outside of the slot, while 64% of Price's short-handed rebounds could be described as safe.
BIG SAVE %
The average percentage of short-handed saves made that were produced on shots considered scoring chances was 19%. Expressed differently, this means that 19% of the total short-handed saves made by goaltenders came on shots considered scoring chances. The higher the number, the higher the quality of saves.
Surprisingly, Price had a substantially-higher short-handed "big save" percentage than Ludqvist. Twenty-two percent of short-handed saves made by Price came on scoring chances, while only 17% of Lundqvist's saves were scoring chances. This could be explained many ways; from quality of competition, to better defensive-play.
SAVE %
This number is the percentage of shots faced that a goalie stops. It is identical to the traditional save-percentage widely used to evaluate goaltenders.
The average short-handed save percentage produced in games scouted was 89%. Price's short-handed save percentage of 95% was substantially above-average, while Lundqvist's SH save percentage of 89% was both equal to the average; and surprisingly low.
SHORT-HANDED RATING
The average short-handed rating produced by goalies is 1.87. Due to an impressive short-handed save percentage, Price has a solid short-handed goaltending rating of 2.19. Thanks to impressive rebound control, Lundqvist's identical rating of 2.19 overcame his relatively low save-percentage.
PUCK HANDLING RATIO
The average short-handed puck-handling ratio produced by goaltenders is 5.25. This means that goaltenders made an average of 5.25 successful passes, or dump-outs for every 1 unsuccessful pass or dump-out.
Price has a below average short-handed puck-handling ratio, while Lundqvist has yet to make any unsuccessful puck-handling plays short-handed. That said, neither goalie has nearly enough events within this category to produce any reflective numbers.

EVEN-STRENGTH
NO REBOUND %
The average rate at which goaltenders scouted using this system have been able to avoid giving up any even-strength rebounds is 35%.
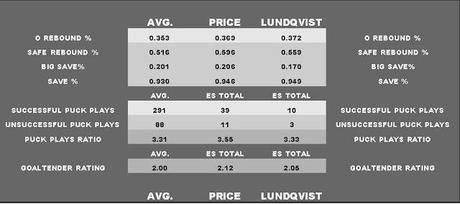
Lundqvist has a slightly higher even-strength "no rebound" percentage than Price. Lundqvist deflected the puck out of play or froze 37% of the shots he faced at even-strength, while Price did the same with just under 37% of shots.
SAFE REBOUND %
The average rate at which goaltenders were able to keep the rebounds they produced at even-strength out of the slot was 52%.
Price has a higher "safe rebound" percentage at even-strength. Sixty percent of the rebounds he produced landed outside of the slot, while 56% of Lundqvist's even-strength rebounds could be described as safe.
BIG SAVE %
The percentage of even-strength saves made by the goaltenders I've scouted that were produced on shots considered scoring chances was 20%.
Price had higher ES "big save" percentages than the Lundqvist. Twenty percent of even-strength saves made by Price came on scoring chances, while only 17% of Lundqvist's saves were on scoring chances. Again, this could be explained many ways; from quality of competition, to better defensive-play.
SAVE %
The even-strength save percentage produced in games scouted was 93%. Price's even-strength save percentage of 94.6% was just slightly under Lundqvist's ES save percentage of 94.9%.
EVEN-STRENGTH RATING
The average even-strength rating produced was 2.00. Thanks to above-average numbers in every even-strength category Price was able to push his even-strength goaltending rating (2.12) well above-average. Lundqvist also had an above-average ES rating (2.05); which was helped by his save-percentage, as well as his overall rebound control.
PUCK HANDLING RATIO
The average puck-handling ratio produced by goaltenders at even-strength is 3.31. This means that goaltenders made an average of 3.31 successful passes, or dump-outs for every 1 unsuccessful pass or dump-out.
Price has shown himself to be the more active puck-handler, as he engaged in over 4 times as many puck-handling events as Lundqvist (through the same amount of games). Price is also the more successful puck-handler, with a ratio of 3.55 successful events for every 1 unsuccessful event. Lundqvist has a ratio of 3.33.

One of the more interesting results within this exercise is the fact that both Lundqvist and Price have higher short-handed ratings than even-strength ratings. It is made even more interesting when we see that Montreal had the second-best penalty-killing success-rate last season, while the Rangers had the fifth-best.
Please keep in mind, this tracking system is still young. It will produce its best results in the future, as more data is compiled.
