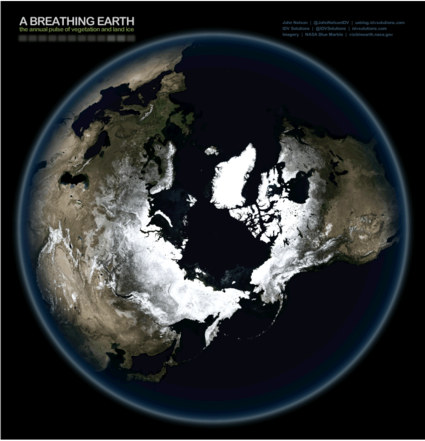
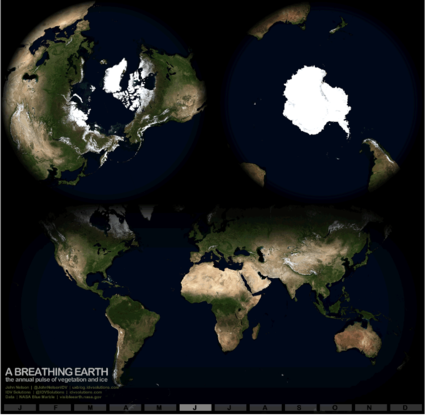
I came across a beautiful infographics by John Nelson about the annual pulse of vegetation and land ice – an impressive visualisation of the heartbeat of our Mother Earth. Click on this link and then on the picture to see the pulse of the earth moving (it might take a moment to load).
To create this pulsating image John took 12 NASA images showing Earth at each of the twelve months: “This animation shows an oddly mesmerizing dance of snow and life, from the vantage of the North Pole.”
There is also a version showing different parts of the globe in one image.
The “pulsating earth” reminded me of a beautiful Greenpeace-video about “Mother Earth – She’s alive…“.

Breathing Earth – polar view (c) John Nelson)

Breathing Earth – multiple views (c) John Nelson)
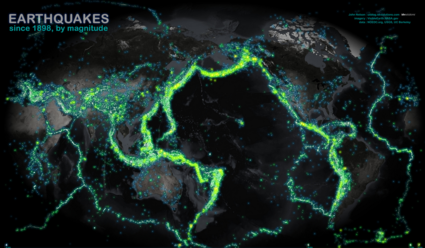
John has created a number of interesting infographics. A very impressive one is the graphics about “Earthquakes since 1898“: “With a heaping pile of data from NCEDC.org, every recorded earthquake with a magnitude of 4 or higher was spattered onto this map.” So you see the places where you stand a bigger chance that the ground under your feed is shaking…

“Earthquakes since 1898″ (c) John Nelson)
