 There has been a lot of talk on cable news recently about how the Democratic race for the presidential nomination is getting closer. And much is said about how Iowa and New Hampshire could change the dynamic, and propel Bernie Sanders to the nomination.
Those who want that to be true point to the 2008 primary season -- where Hillary Clinton had a lead in the polls until Barack Obama beat her in Iowa and made New Hampshire a close race. Obama went on to win the nomination.
But the problem for Bernie is that 2008 was very different from 2016 -- and Iowa and New Hampshire are very different from the states that follow them. Iowa and New Hampshire are states with a very small minority population -- states where White liberals make up the largest share of the Democratic vote. After doing well in those states, Obama went on to states where the Democratic population was much more suited for him (states where minorities make up a significant portion of Democratic voters) -- and even then it was not easy for him. For instance, Obama edged Clinton by only 13 delegates on Super Tuesday (847 to 834).
But Sanders has been unable to crack the minority vote -- making the states where White liberals (his constituency) have a smaller portion of the Democratic vote much tougher sledding for him than it was for Obama. Minority voters have been very solid in their support for Clinton, and it is unlikely that Sanders making Iowa close and winning New Hampshire will change that. While Obama in 2008 went into friendlier territory after Iowa and New Hampshire, Sanders will be going into states that are much tougher for him (where the polls show he has very little support compared to Clinton).
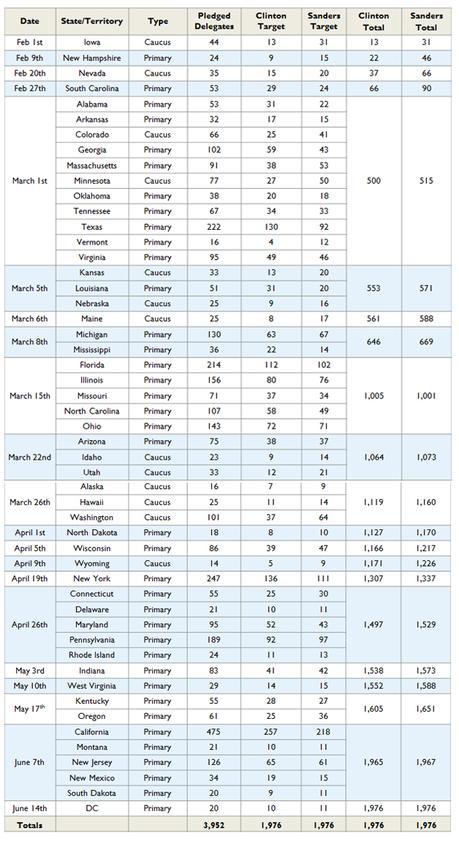
The Cook Political Report has created the chart below. It shows what each candidate would have to accomplish in all the states to just garner an even number of delegates in the primaries/caucuses. They said:
To gauge the difficulty of Sanders's task, we built an estimate of how many delegates Clinton and Sanders would need in each state to win exactly 50 percent of pledged Democratic delegates. To build our model, we relied on results from the latest NBC/Wall Street Journal survey broken down by race and ideology. Then we applied them to the racial and ideological makeups of each state's Democratic electorate, gleaned from 2008 and 2012 exit polls and adjusted for recent population changes.
NBC/Wall Street Journal found Clinton performing better with non-whites and Sanders performing best with liberals, but we made several additional assumptions. First, we assumed a modest five percent "home state bump" for Sanders in Vermont and for Clinton in New York. Second, based on past primary patterns, we assumed that Sanders will perform ten percent better in caucus states than primary states, which may be generous to Sanders. Third, we assumed that Martin O'Malley will not hit Democrats' mandatory 15 percent threshold to earn delegates in any state or district.
How this works: The scorecard below is not a prediction or forecast. Rather, it's a tool to gauge Clinton's and Sanders's true progress towards the nomination. At any given point in the primaries, the candidate who exceeds his or her cumulative delegate target should be regarded as the frontrunner.

Even if Sanders could accomplish that, he would still lose -- because this chart doesn't include the 713 superdelegates. Clinton already has the support of 380 of these delegates (well over half), while Sanders has the support of 11. He would have to not only convince all of the remaining delegates to support him, but would have to take a couple of dozen delegates away from Clinton.
Bernie Sanders has a huge mountain to climb to win the 2016 Democratic nomination -- and that climb is much more difficult than the one Barack Obama had in 2008.
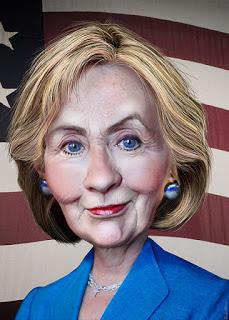
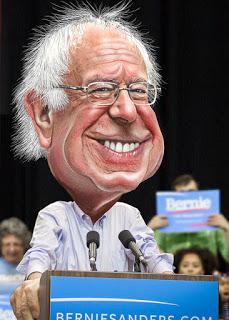
(NOTE -- The caricatures above of Sanders and Clinton are by DonkeyHotey.)

