I get it. Figuring out bar and restaurant cost percentages might bore you to tears or even make you want to pull your hair out by the roots, but these numbers are the key to your success. Like using a road map, by analyzing where you're at, you are able to adjust your course to get where you need to be so you can run a mega-successful bar and restaurant.
This restaurant industry standards guide is for those bar and restaurant owners and managers who have no idea what to do and who are just starting out, all the way to the professional who has some experience but wants to fine-tune his/her numbers. We cover cost percentages and how to run a successful bar and restaurant in great depth in the Restaurant Management Masterclass, but if you're just looking for a bar and food cost percentage guide, this will help you quite a bit.
Now, what you need to understand is that not all bars & restaurants are created equal. A fine-dinging restaurant is going to have different benchmarks than a nightclub, dive-bar or fast-casual restaurant. That means that the numbers will not exactly match, but this will give you a starting point to work from and then you can adjust from there.
NOTE: These are benchmarks you SHOULD be hitting. The ACTUAL industry standards are often much worse. Off we go then...
Target Benchmarks You Need to Hit to be Successful

ALCOHOL
The bar is usually your most profitable money-maker, especially the liquor. A reminder here to focus on selling your most profitable brands and menu items and not just your lowest cost percentage items. For instance, well liquor might pour at 5% and yield a $5 profit, whereas Grey Goose vodka might pour at 18% and yield a $7.50 profit. Don't just focus on percentage. Always focus on profit first.
- LIQUOR: 16 - 19%
- BOTTLED BEER: 22 - 26%
- DRAFT BEER: 20 - 25%
- WINE: 22 - 35%
NON-ALCOHOLIC
- SODAS: 10 - 12%
- COFFEE: 15 -18%
- SPECIALTY COFFEE: 12 - 15%
FOOD
- FOOD: 28 - 32% (depending on fine or casual dining)
PAPER PRODUCTS
LABOR
- MANAGEMENT SALARIES: 8 - 10%
- FOH & BOH HOURLY EMPLOYEES: 18 - 22%
- BENEFITS: 4 -6%
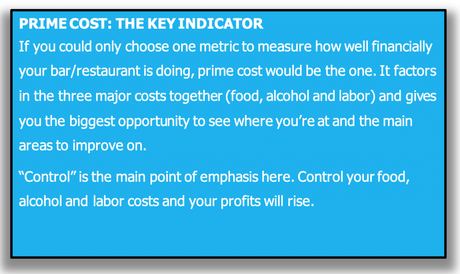
PRIME COSTS (COGS + PAYROLL ÷ SALES)

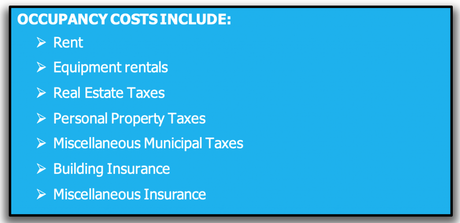
OCCUPANCY
- RENT: 8 - 10%
- TAXES & MISC. 3 - 4%
- TOTAL OCCUPANCY: 10% OR LESS

SALES/SQ. FOOT (ANNUAL SALES ÷ SQ. FOOTAGE)
- LOW/LOSING MONEY: <$200/SQ. FOOT
- AVERAGE/BREAK EVEN: $200 - $250/SQ. FOOT
- MODEST PROFIT: $250 - $400/SQ. FOOT
- HIGH PROFIT: $400+/SQ. FOOT
SALES PER LABOR HOUR
- $45 PER HOUR PER EMPLOYEE (median average)
Learn More About Increasing Your Profits at Barpatrol.net
Bar Patrol was founded in 2011 by Dave Allred, a 25-year industry veteran who has worked in the trenches as a busser, server and bartender, as well as managed multiple bars in the San Francisco Bay Area.
Dave started Bar Patrol when he saw a gigantic gap in the area of managing numbers and running a profitable bar/restaurant business, as most people in management positions have not been properly educated on the financial side of running a business.
Specifically, Bar Patrol focuses on an easier, faster more accurate way of taking your bar inventory, as well as your food inventory in order to count faster, control costs, do ordering and invoicing and item costing.
To view Bar Patrol's inventory app and online inventory software, visit Barpatrol.net, or contact them at [email protected].
We wish you all the best in running a profitable bar/restaurant.
Cheers,
Dave

