%%bloglink%%
There are three main investment fears that can cause the price of a corporate bond to fall:
Fear that the company behind the bond may not be able to keep up with their interest payments.
- Fear that the company behind the bond may not have the financing in place to pay the bond off at 100 cents on the dollar at maturity.
- Fear of missing out on better returns by investing in something other than this bond.
I refer to the first two fears as a Liquidity Crisis.
Does the company have enough sales/profits to keep the interest payments flowing?
The last fear I refer to as a Popularity Crisis.
Popular investments attract more money. Popular investments may or may not pay off in the long run, but that doesn’t stop people from doing the fashionable thing of following the crowd into or out of certain areas of the market.
I am much more afraid of a Liquidity Crisis than Popularity Crisis.
During a Liquidity Crisis, bond holders may or may not get their money back.
During a Popularity Crisis, bond holders get their money back they just may or may not have made as much money as other investments.
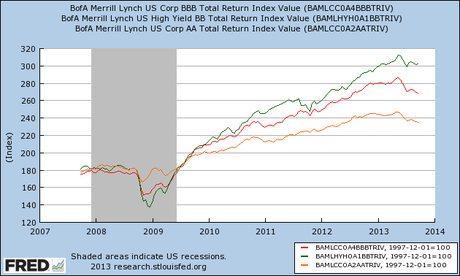
This chart shows three sections of the U.S. corporate bond market (AA, BB and BBB or rather high investment grade to low investment grade) and their returns over the past few years.

Returns have fallen almost in unison starting in May 2013. The last time these three sectors fell like this was late 2008 to early 2009.
Then, bond prices fell because due to a Liquidity Crisis (a return OF my money). Now, however, it’s not a fear of not being paid that is spooking investors but rather a Popularity Crisis or fear of being left behind as other investments are doing better (a return ON my money).
Companies
- Corporate Profits After Tax[i]
- Then: From March 2008 to March 2009 corporate profits fell by 9.3% to $1,115.1 billion.
- Now: From Q1 2012 to Q1 2013 corporate profits have increased by 5.7% to $1,830.4 billion.
- Personal Dividend Income[ii](the amount of money investors received from company dividends)
- Then: From March 2008 to March 2009 companies cut their dividends by 27.4% to $626.9 billion.
- Now: From July 2012 to July 2013 companies increased their dividends by 11.1% to $796.1 billion.
Consumers
- New Auto and Light Truck Sales[iii]
- Then: From March 2008 to March 2009 auto and light truck sales fell by 35.4% to 9.552 million units sold.
- Now: From August 2012 to August 2013 there was an 11.08% increase in car and truck sales to 16.023 million units.
- Total Percentage of Non-Performing Loans[iv](the percentage of loans that are 90+ days past due)
- Then: From March 2008 to March 2009 banks reported a 125% increase in non-performing loans of to 4.38% of outstanding loans.
- Now: From Q1 2012 to Q1 2013 bank have reported a 20.8% decrease in non-performing loans 20.8% to 3.15% of total loans.
Economy
- U.S. Exports of Goods and Services[v]
- Then: From March 2008 to March 2009 total exports fell by 20.8% to $378.626 billion.
- Now: From Jan 2012 to Jan 2013 total exports increased by 2.0% to $559.018 billion.
- New Orders for Capital Goods excluding Defense and Aircraft Orders[vi](capital goods are products with an expected lifespan of three years or longer)
- Then: From March 2008 to March 2009 new orders dropped by 25.1% to $49.149 billion.
- Now: From July 2012 to July 2013 new orders have increased by 7.4% to $66.924.
Employment
- 4 Week Average Initial Claims for Unemployment[vii]
- Then: From March 2008 to March 2009 there was an 84.8% increase in initial claims to 654,875 individuals
- Now: From August 2012 to August 2013 there was a 10.0% decline in initial claims to 331,900 individuals.
- Total Non-Farm Private Payroll Employment[viii]
- Then: From March 2008 to March 2009 non-farm payrolls fell by 5.1% to 109.544 million people working.
- Now: From August 2012 to August 2013 non-farm payrolls rose by 1.8% to 113.981 million people working.
Stock Market
- S&P 500 Stock Index[ix]
- Then: From March 2008 to March 2009 the S&P 500 Stock Index fell by 42.5% to 757.13.
- Now: From August 2012 to August 2013 the S&P 500 Stock Index has increased by 18.9% to 1,670.09.
[i] St. Louis Federal Reserve. Data series CP
[ii] St. Louis Federal Reserve. Data series DIVIDEND
[iii] St. Louis Federal Reserve. Data series ALTSALES
[iv] St. Louis Federal Reserve. Data series NPTLTL
[v] St. Louis Federal Reserve. Data series BOPXGS
[vi] St. Louis Federal Reserve. Data series NEWORDER.
[vii] St. Louis Federal Reserve. Data series IC4WSA
[viii] St. Louis Federal Reserve. Data series NPPTTL
[ix] St. Louis Federal Reserve. Data series SP500
