 It became clear in the last election that a couple of demographics were hurting the Republican Party. Minorities and women voted against Republicans in large numbers in 2012, because that party supports policies that discriminate against both of those groups. And this is not likely to change in the future (since the percentage of minority voters will grow in the future). Republican leaders of the national party know this, and urged the party's elected officials to moderate their policies toward both of those groups. But the party's teabagger/fundamentalist base didn't like that idea, and following their lead, congressional Republicans have just doubled down on those racist/misogynistic policies.
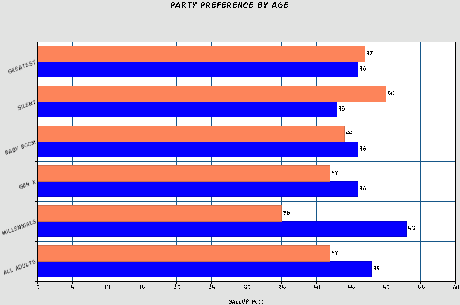
That would be bad enough for the Republican Party, especially in national elections -- and makes it increasingly unlikely they can reclaim the White House in the future. But now there is another demographic that will work against the Republican Party in the future -- the age demographic. This is illustrated in the chart above. Note that the younger the age group, the less support they give to Republicans.
Especially important for Republicans are the older voters. Elderly voters vote in a much higher percentage than voters of any other age group, and currently they favor Republicans -- especially those in the Silent and Greatest generations. Republicans have counted on these voters to offset their lack of votes in other demographic groups. But that is now changing. The members of these two age groups (born before 1946) are dying off, and they are being replaced by the Baby Boomers (born between 1946 and 1964) -- and these Baby Boomers prefer the Democratic Party by a small margin. In 2012, these Baby Boomers made up 36% of the U.S. electorate.
That means, in a short time, the Republican Party will no longer be able to count on seniors to help them. In fact, those seniors will increasingly prefer the Democratic Party (as women and minorities already do) -- and when that happens, the demographic hurt to the GOP will spread from national elections down to state and district elections.
The chart above was made from information provided by the Gallup Poll.

