Rule et al.’s (2015) article on the State of the Union makes the rather bold claim (for literary and rhetorical scholars) that changes to the SotU’s medium of delivery has had no effect on the form of the address, measured as co-occurring word clusters as well as cosine similarity across diachronic document pairs. I’ve just finished an article muddying their results a bit, so here’s the initial data dump. I’ll do it in a series of posts. Full argument to follow, if I can muster enough energy in the coming days to convert an overly complicated argument into a few paragraphs.
First, cosine similarity. Essentially, Rule et al. calculate the cosine similarity between each set of two SotU addresses chronologically—1790 and 1791, 1791 and 1792, and so on—discovering high similarity measurements (nearer to 1) across most of the document space prior to 1917 and lower similarity measurements (nearer to 0) afterward, which they interpret as a shift between premodern and modern eras of political discourse. They visualize these measurements in the “transition matrices”—which look like heat maps—in Figure 2 of their article.
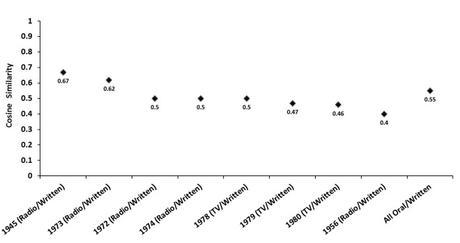
Adapting a Python script written by Dennis Muhlestein, I calculated the cosine similarity of States of the Union delivered in both oral and written form in the same year. This occurred in 8 years, a total of 16 texts. FDR in 1945, Eisenhower in 1956, and Nixon in 1973 delivered written messages to Congress as well as public radio addresses summarizing the written messages. Nixon in 1972 and 1974, and Carter in 1978-1980 delivered both written messages and televised speeches. These 8 textual pairs provide a rare opportunity to analyze the same annual address delivered in two mediums, making them particularly appropriate objects of analysis. The texts were cleaned of stopwords and stemmed using the Porter stemming algorithm.

Cosine similarity of oral/written SotU pairs
The results are graphed above (not a lot of numbers, so there’s no point turning them into a color-shaded matrix, as Rule et al. do). Cosine similarity hover arounds 0.50, with Eisenhower’s 1956 addresses emerging as the most dissimilar pair and FDR’s 1945 addresses emerging as the least dissimilar pair. The average of all 8 textual pair measurements is 0.51.
Likewise, the cosine similarity measurement of all written (140 of them) and all oral SotU texts (106 of them)—copied chronologically into two master files—is 0.55, remarkably close to the average of the 16 texts measured above.
The conclusion to be drawn is that written and oral States of the Union are, on average, ~50% similar to one another, with a variation extending somewhere between 40% and 67%. There is much ambiguity in these measurements. On one hand, they can be interpreted to suggest that Rule et al. overlooked differences between oral and written States of the Union; the measurements invite a deeper analysis of the corpus. On the other hand, the measurements also tell us not to expect substantial variation.
In the article (to take a quick stab at summarizing my argument) I suggest that this metric, among others, reflects a genre whose stability is challenged but not undermined by changes to medium as well as parallel changes initiated by the medial alteration.
But you’re probably wondering what this cosine similarity business is all about.
Without going into too much detail, vector space models (that’s what this method is called) can be simplified with the following intuitive example.
Let’s say we want to compare the following texts:
Text 1: “Mary hates dogs and cats”
Text 2: “Mary loves birds and cows”
One way to quantify the similarity between the texts is to turn their words into matrices, with each row representing one of the texts and each column representing every word that appears in either of the texts. Typically when constructing a vector space model, stop words are removed and remaining words are stemmed, so the complete word list representing Texts 1 and 2 would look like this:
“1, Mary”, “2, hate”, “3, love”, “4, dog”, “5, cat”, “6, bird”, “7, cow”
Each text, however, contains only some of these words. We represent this fact in each text’s matrix. Each word—from the complete word list—that appears in a text is represented as a 1 in the matrix; each word that does not appear in a text is represented as a 0. (In most analyses, frequency scores are used, such as relative frequency or tf-idf.) Keeping things simple, however, the matrices for Texts 1 and 2 would look like this:
Text 1: [1 0 1 1 1 0 0]
Text 2: [1 1 0 0 0 1 1]
Now that we have two matrices, it is a straightforward mathematical operation to treat these matrices as vectors in Euclidean space and calculate the vectors’ cosine similarity with the Euclidean dot product formula, which returns a similarity metric between 0 and 1. (For more info, check out this great blog series; and here’s a handy cosine similarity calculator.)

The cosine similarity of the matrices of Text 1 and Text 2 is 0.25; we could say that the texts are 25% similar. This number makes intuitive sense. Because we’ve removed the stopword ‘and’ from both texts, each text is comprised of four words, with one word shared between them—
Text 1: “Mary hates dogs cats”
Text 2: “Mary loves birds cows”
—thus resulting in the 0.25 measurement. Obviously, when the texts being compared are thousands of words long, it becomes impossible to do the math intuitively, which is why vector space modeling is a valuable tool.
~~~
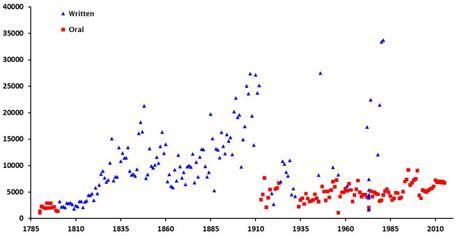
Next, length. Rule et al. use tf-idf scores and thus norm their algorithms to document length. As a result, their study fails to take into account differences in SotU length. However, the most obvious effect of medium on the State of the Union has been a change in raw word count: the average length of all written addresses is 11,057 words; the average length of all oral speeches is 4,818 words. Below, I visualize the trend diachronically. As a rule, written States of the Union are longer than oral States of the Union.

State of the Union word counts, by year and medium
The correlation between medium and length is most obvious in the early twentieth century. In 1913, Woodrow Wilson broke tradition and delivered an oral State of the Union; the corresponding drop in word count is immediate and obvious. However, the effect is not as immediate at other points in the SotU’s history. For example, although Wilson began the oral tradition in 1913, both Coolidge and Hoover returned to the written medium from 1924 – 1932; Wilson’s last two speeches in 1919 and 1920 were also delivered as written messages; nevertheless, these written addresses do not correspond with a sudden rebound in SotU length. None of the early twentieth century written addresses is terribly lengthy, with an average near 5,000.
The initial shift in 1801 from oral to written addresses also fails to correspond with an obvious and immediate change in word count. The original States of the Union were delivered orally, and these early documents are by far the shortest. However, when Thomas Jefferson began the written tradition in 1801, SotU length took several decades to increase to the written mean.
Despite these caveats, the trend remains strong: the oral medium demands a shorter State of the Union, while the written medium tends to produce lengthier documents. To date, the longest address remains Carter’s 1981 written message.
~~~
More later. Needless to say, I believe there are formal differences in the SotU corpus (~2 million words) that seem to correlate with medium. However, as I’ll show in a post tomorrow, they’re rather granular and were bound to be overlooked by Rule et al.’s broad-stroke approach.
