 Yesterday I wrote a post on race and political party preference. It showed that while Republicans have a 9.5 point advantage over the Democrats among Whites, they have a 47.2 point disadvantage among Non-whites -- and Whites are a decreasing portion of the electorate, while Non-whites increase their percentage of total voters with each election. In short, it painted a pretty dismal picture of the future of the Republican Party.
Today, I want to look at the political party preference according to age. Like yesterday, the information comes from the Gallup Poll (which interviewed 18,000 nationwide adults in 2013 and the same in previous years to get their results, which have a margin of error of only 1 point). And the results according to age don't look any better than the racial results did for the GOP.
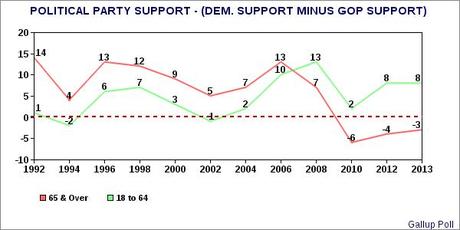
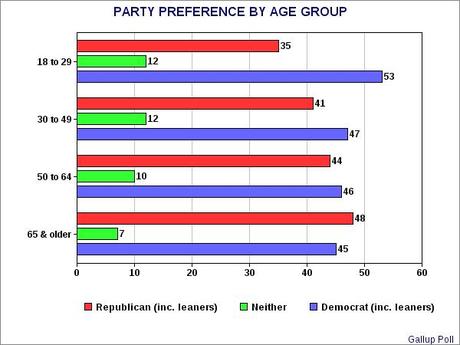
Note from the charts above that there is only one group that has moved toward the Republican Party in the last few years. In the top chart, the dotted red line is the cut-off point, and above the line favors the Democrats while below that line favors Republicans (with the chart numbers being gotten by subtracting Republican support from Democratic support). Note that seniors are trending toward the Republican Party -- even though seniors have traditionally been a group that favored Democrats.
In the past, seniors favored Democrats because they had lived through the Depression. They saw firsthand how badly the Republicans screwed the economy and they didn't want it to happen again. But there are very few of that generation left now, and this latest generation of seniors grew up in a different situation -- with segregation being a reality. They are the generation that fled the Democratic Party when President Johnson muscled the Civil Rights bill through Congress, and made the GOP the majority party in the South.
As a senior myself (born in the first wave of the Baby Boom), I hate to admit it but it looks like the current move by seniors to the GOP is racially motivated. Note that it did not happen until the Democrats nominated and elected an African-American president of this country. Whites make up a larger portion of seniors (85%) than any other age group, so it should not surprise anyone that racism would have more of an effect among seniors than other age groups.
But the charts also show something else -- that all the other age groups prefer the Democrats by varying margins. And the biggest margin is among the youngest voters -- and these voters are setting a voting pattern they will generally follow the rest of their lives. This means that the future doesn't look too bright for the GOP when it comes to age, because as the seniors (the group that prefers them) die off they will be replaced by younger and more liberal voters -- voters who prefer the Democratic Party (and who don't want to hear the racist message of the Republican Party).

