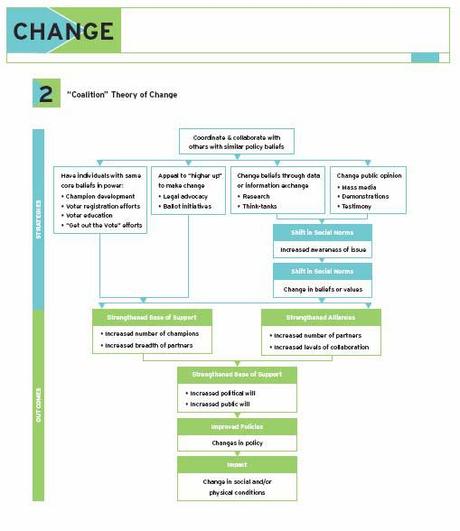
Mapping advocacy impact. (Image: OSR)
One of the aspects of CIPE’s work that deserves more discussion is the suite of evaluation methods that CIPE staff use to assess the outcomes, results, and impact CIPE partners have worldwide.
Evaluation is growing as a field. Over the last decade, with increased aid funding in countries like Iraq and Afghanistan, policymakers are asking for evidence that change has occurred as a result of U.S.-funded programs overseas. That can be easy in some fields – vaccine distribution, for example, can easily be measured in terms of population served, number of doses given, geographical spread, decrease in disease vectors, and on and on. These statistics are easy to understand and demonstrate impact clearly.
But what about those of us who work in fields where change can’t be quantified so easily? Measuring impact can be tough. Advocacy is one of the fields where some concrete measurement can occur – did new legislation get put in place? – but often, looking beyond actual policy change to implementation tells the real story.
A new publication from Organizational Research Services, called “Pathways for Change: 6 Theories about how Policy Change Happens,” looks more closely at approaches to advocacy and how they can be evaluated. Even better, they created maps like the one at the top of this post to different advocacy approaches. Here’s how they describe their work:
Just as academics develop theories, advocates have their own ideas about what will help them achieve or move toward a policy “win.” These internal ideas or assumptions about policymaking, also called theories of change, can be documented as visual diagrams that express the relationships between advocacy actions and hoped-for results. When articulated, these strategy and belief system roadmaps can clarify expectations internally and externally, and facilitate more effective planning and evaluation.
CIPE’s evaluation methodology can be read in depth in our 25 Year Impact Evaluation Report.

