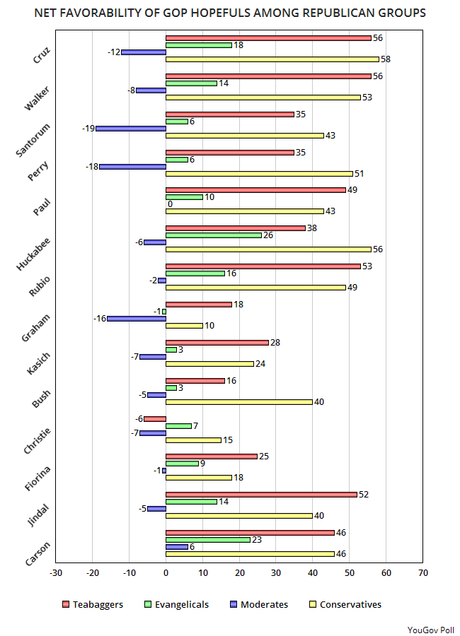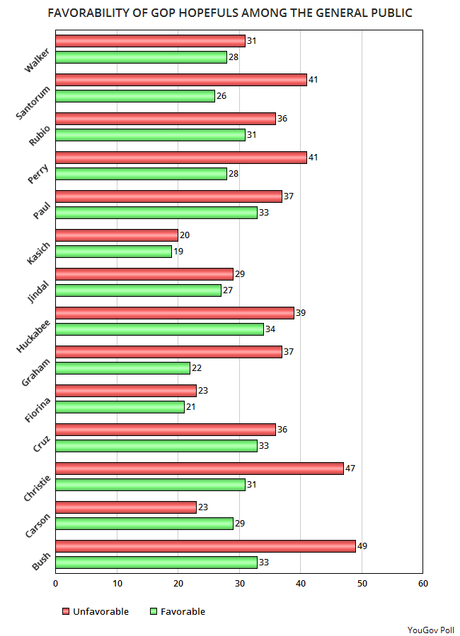
I found these two charts interesting. Both were made from a YouGov Poll done between March 14th and 16th of a random sample of 1,000 adults (with about a 4 point margin of error).
The top chart shows the popularity of the possible candidates among the four major groups in the Republican Party base -- the teabaggers, the evangelicals (social conservatives), the moderates, and the conservatives (fiscal conservatives, i.e., "establishment"). As you can see, the groups don't necessarily agree. I expect the major war to nominate a candidate will be between the teabaggers and the conservatives -- with the teabaggers appealing to the evangelicals for help, and the conservatives appealing to moderates for help.
It's still early, but right now I would give a slight edge to the candidates favored by the teabaggers. But they will be outspent by the conservatives (establishment), and that money could swing the race.
The bottom chart shows what the general public thinks of the Republican hopefuls. It shows the Republicans have a long way to go to present a candidate acceptable to a majority of the general public. Note that every single Republican hopeful but one has an upside-down favorability rating (with those viewing them unfavorable outnumbering those viewing them favorably). The only candidate without an upside-down rating in Carson, and most of the public doesn't know who he is. I expect his unfavorable rating to climb substantially as people get to know him.


