Page speed and website loading time is a critical factor in the current Google ranking algorithm. There are also several studies which indicate that the visitors will abandon the slow loading sites very quickly no matter how useful they tend to be. If we take an example of Amazon, with every 100ms savings in the load time Amazon’s revenue increases by 1%.
We present some tools, that Itber Moya, an application developer and blogger for caminandocondios.net recommended us, which will be helpful in analyzing the current website loading time and also enhance the performance by following suggestions and advice by companies like Google and Yahoo.
Google PageSpeed

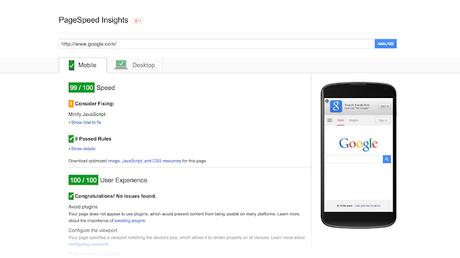
Let’s start measuring website loading time using the PageSpeed tool by Google. PageSpeed tool follows some best practices laid down by Google and compares the given webpage against those best practices.
Go to Google Page Speed and get insight for your page online. PageSpeed Insights performs several tests on the the content of a web page, assign a page score to the tested URL and suggests the possible ways to make it perform better.
You can also check how fast your website loads on a mobile phone. Click on the ‘Mobile’ button next to the address bar or click on the ‘Mobile Report’ in the tip box.You can also install PageSpeed Insight extensions in your Chrome or Firefox browsers . While surfing on the web, open the PageSpeed Insight and click ‘Analyze Performance’ to instantly check the performance of any web page.
GTmetrix

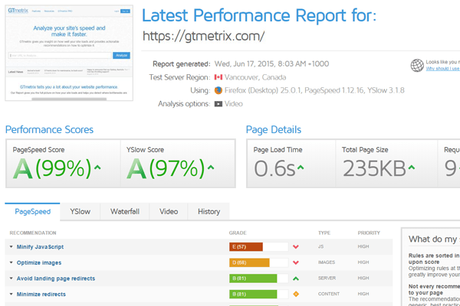
GTmetrix allows you to check the web page loading time and generates a detailed report also with explicit information about every element that affects loading time of a page. It will test the URL in both Google PageSpeed and Yahoo YSlow tools and displays the results in different tabs. The best part of GTmetrix is that it also gives a waterfall overview of the components loaded sequentially. This will give you a better idea on which module is taking the most time to load.
In the report, you will find ‘Timeline’ which is a sequential explanation of all the processed requests along with their loading time which were executed while loading the web page. You can use this information to remove the processes that need longer time and slows down the loading of your web pager. We tend to add, delete and make changes in the elements of our web page. Consequently, the loading time of our web varies due to these change.
You may find yourself interested to track the page load times, page sizes, page speed and Yslow score over any period of time using the’ History’. This report is also available in the PDF format so that you may download the executive summary of Latest Performance. Compare two or more websites using the option provided at the left side of the page.
Sign up for a free account to save and track all your reports as long as you want.You can also track multiple URL s and get reports on daily, weekly or monthly basis.You would love to know that using GTmetrix you can test your URL from many different locations too.
Site 24×7.com web page analyzer
Site 24×7 provides different features and tools that are useful for maintaining and monitoring your website. One of the feature is Web Page Analyzer tool. It gives a waterfall loading sequence of the given URL. This can help us track down the bottlenecks in our site’s loading time.
It will generate a detailed response time summary, webpage summary and the domain summary.You can also email this report to your colleagues or even yourself , share it on Facebook or tweet it! Webpage summary is quite readable as its presented using graphs. If the results are not satisfactory then you may also like using the ‘Code Cleaner‘ validation tool (listed below in the same page). Code cleaner removes unnecessary coding and tries to optimize your web page.
Pingdom Tools

Pingdom Tools is one of the most popular webpage performance and analysis utility. Pingdom saves history of your recently tested URLs so that you can analyze the site’s performance over a period of time. One compromise that you have to make on Pingdom is the facility of testing URL from only three different locations. You can also check the DNS Health of your website using Pingdom tools.
After analysis, a detailed report is generated which can be downloaded as PDF. It describes the waterfall, performance grade, page analysis and history which is similar toGTmetrix. For constant monitoring of your website, you can sign up for a free account on Pingdom.
Web Page Test
Web page test tool is unique as it allows you to choose from a wide variety of server locations and list of browsers to test the web page speed. Go to web page test tool -> enter URL -> select location and browser -> start test You can also customize test settings according to your needs. It is an advanced tool that provides very technical information about the entered URL. It takes a few seconds to perform the test and present you the results.
You can see the summary, performance review, page speed and other details by selecting the desired tab in the menu bar. If you think that the results are not satisfactory enough then you can easily visit the forums and discuss it with other web developers.
You can also use Google Analytics Tools to know your demographic traffic details and make sure that your website loads faster in the regions from where you get the most traffic. Which tools do you use to check your web site’s performance?

