In this digital world, it seems appropriate that modern applications are integrated with every prospect of our lives. From our day-to-day activities to our long-term planning, everything involves applications that make our lives easier. Instead of focusing on mundane tasks that an application can perform, we can focus on more critical tasks at hand.
But gone are the days when people only used modern applications for leisure purposes. Today, modern applications are an integral part of several enterprises because they can provide faster service without compromising quality.
However, we often forget that these applications also require constant monitoring to ensure their ideal working. This monitoring cannot be done manually as we do not have the knowledge or experience to perform regular checks. But the good news is you don’t have to, as there are several monitoring solutions that can help you with this task.
These full-stack monitoring solutions can combine real-user, front-end, synthetic, application stack, and infrastructure tools in one place to provide you exceptional functionality. These tools can take care of:
- End-user Experience
- Network Infrastructure Monitoring
- App Performance Monitoring
- Log File Monitoring
All of these tasks are completed by the several features a full-stack tool has. Some of these features are:
Observability
A full-stack monitoring tool will help you understand the behavior of an application. It gives you a detailed insight into why your applications run into a particular error so that you can fix it. These tools will help you increase productivity by eradicating any problem from the root.
Detailed Metrics
These tools will provide you with an in-depth report about the issues and metrics of your applications. These tools combine application metrics, infrastructure metrics, and transaction metrics to give you a detailed report about everything happening with your applications.
Artificial Intelligence and Machine Learning
Machine learning and AI are the latest trends in the manufacturing industry, and a full-stack monitoring app can leverage this technology to analyze applications’ behavioural patterns. They can even predict their behavior so that you can prepare for it beforehand.
Top five full-stack monitoring tools
Now, as you have a better understanding of what a full-stack monitoring tool does and how it can help grow your business, let’s discuss the top Full-stack Monitoring Solutions available in the market.
Zenoss
Zenoss can help you collect and analyze detailed metrics, stream data, dependency data, agent data, logs, and events across several environments using AIOps. It also leverages machine learning to improve applications’ accuracy and effectiveness. It is an extremely fast tool because of its flexible and server-less cloud architecture paired with intelligent analytics.
Features
- Advanced anomaly detection to understand the root cause behind any problem using a model-informed ML. This will help you to quickly isolate the problem so you can improve your productivity.
- Zenoss’s Timeline will show you your apps and system state, including performance in a systematic way for easy access. You can utilize the real-time model to understand dependencies while monitoring resources in real-time.
- Zenoss also has a voting feature that lets you improve visibility exponentially using supervised ML while adjusting the ranking of vote-related application resources.
- This tool will allow you to prevent IT disruptions through high-cardinality data while ensuring your system’s optimal performance, minimizing digital risks.
Zenoss can help to improve your Mean-Time-To-Resolution by over 85%, reduce event storms and alert noise by 99.99% and accelerate the automation of ITOM systems by 70%.
Sematext
It is an easy-to-use tool, and you can set it up in a matter of minutes. Sematext has a unique dashboard and anomaly alert and detection tool. You can also use context-aware filters to obtain insights such as network interfaces, tags, disks, etc. Sematext will help you reduce MTTR by handling issues sooner, irrespective of their origin.
Features
- Easy integration with Elasticsearch, SolarCloud, Solr, Docker, Nginx, Node.js, Express.js, MySQL, Nginx Plus, MariaDB, Redis, Apache, etc. Using server monitoring, you can also view past and present metrics of your cloud instances and servers. These instances include disk usage, CPU, memory, network, load, and IO.
- You can also view detailed analytics of MyISAM and InnoDB and handle table metrics. It can auto collect communication data for you that includes transmitting and receiving rate.
Dynatrace
By using real-time user monitoring, synthetic transaction monitoring, and session replays, Dynatrace will provide a complete all-around overview of every task. This will help you understand customer behavior, customize their experience and understand the effects of concerning issues.
Features
- Dynatrace can understand any application language, type, or architecture to provide deep code-level visibility. You can easily track every transaction across multiple channels without any possibility of blind spots or gaps.
- This tool will go beyond the application layer to figure out the problems and capabilities of your applications. This infrastructure monitoring will cover every container orchestration layer, virtual network, and infrastructure to provide you a full-stack coverage.
- Dynatrace provides monitoring automatically apart from smart alerting and problem detection across cloud-native and hybrid environments.
New Relic
You can determine the root of the issues and immediately resolve them by leveraging in-depth transaction data. This data will allow you to choose the accurate method calls through line numbers. By viewing all the data simultaneously, you can get a clear understanding of your applications.
Features
- New Relic provides you a complete insight into several metrics to help you understand your system’s performance. This will help you address any underlying issue and improve the efficiency and productivity of your applications.
- This tool can combine RUM, synthetic and native application server monitoring for optimal performance and uptime across several services, URLs, APIs, etc.
- By understanding every metric and the in-depth working of your system, you can improve the user experience.
Sysdig
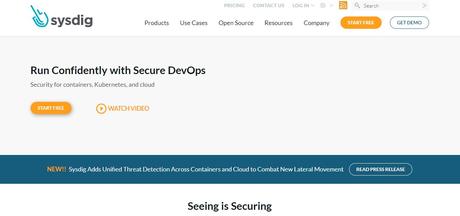
Sysdig can also help you get rid of silos by collecting information from various hybrid and multi-cloud monitoring teams. This will help your developers by giving them clear and detailed information about the working of the system. Prometheus compatibility ensures that the tool gets in-depth knowledge and visibility of your volatile container environment.
Features
- Sysdig can explore and auto-discover container, cloud, and Kubernetes environments to provide complete visibility to improve applications’ performance.
- Monitor network connections such as ingress and egress for every process and service.
- Discover metrics and events and convey them to every system, such as request count, response time, latency, and error count.
- A smart trigger system call capture that can execute troubleshooting even when offline.
Conclusion
It is essential to monitor your application stack, and only the best full-stack monitoring solutions can achieve that. It will keep your applications updated and optimized for performance. All of the tools mentioned above are excellent and will give you desired results. You can choose any one of them for a complete monitoring solution for your application stack.

