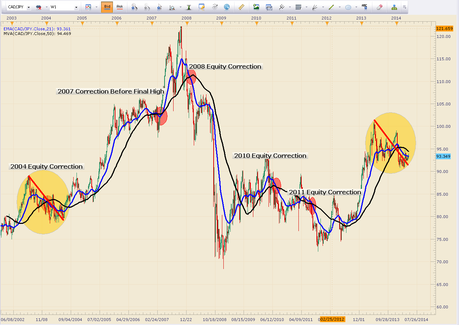
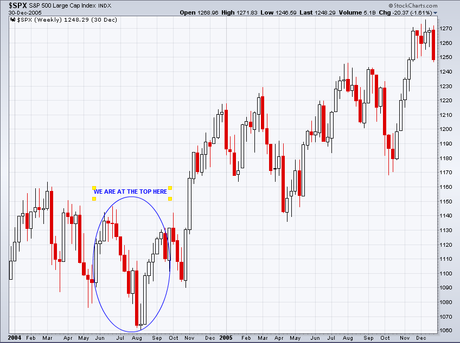
 As you can see from the chart, we are currently tracking the 2004 time frame in CADJPY, with a cycle low coming right on time on April 26, 2014 when the 2004 time period is extrapolated to today. Now, in 2004, CADJPY diverged from equities and began moving up right before the final equity leg down. It looked like the June to August 2004 sell off on the S&P 500:
 If we take that data and apply it to today, it extrapolates perfectly to a low the week of June 23, 2014.
 Now, there is cycle corroboration for that week being the low. Specifically, it is also the 20 week cycle low, which is shown below:
 From a price standpoint, we have a diamond formation on the SPY Daily Chart:
 If you measure the top and bottom of the diamond, it projects to an S&P 500 Price target of around 1730, which would also fill the 10/13/2013 gap on SPY. The entry for such a formation is to take the break of the lower diamond trend line, which also would put us below the 21 EMA, the 50 SMA, and the Daily Cloud Baseline support if broken.
There is always a bear path and a bull path. As always, do your own due diligence, read the disclaimer, and make your own investment decisions.
Peace, Om, SoulJester
