Every business manager should have a KPI DASHBOARD software.
It provides a quick view of a company’s performance, well-being, and projected growth by gathering, categorizing, organizing, and visualizing the company’s most important metrics.
Organizations can access KPI dashboards and see their success indicators in real-time, enabling them to make informed decisions that help them reach long-term goals.
KPI dashboard software is available in a number of forms. It can range from simple tools for tracking metrics to advanced business intelligence software.
What is KPI Dashboard Software?
KPIs (Key Performance Indicators) are measures of performance that reveal how effective an organization is at achieving its important business goals.
They allow organizations to determine how successful they are and reach their goals.
Performance metrics are tracked at different levels within businesses using KPIs. In general, higher-level KPIs are more concerned with a business’s general performance while lower-level KPIs are more concerned with its business processes or employees across departments.
A KPI Management system enables organizations to develop, manage, visualize, and evaluate KPIs (Key Performance Indicators).
Benefits Of KPI Dashboards
Business intelligence and KPI software are beneficial in many ways. Here are just a few.
1. Assess Business Performance
You can measure your business health quickly with business intelligence software. Without it, you might end up crashing your enterprise.
2. Get A Holistic Picture
You can lose customers if you adopt a tunnel view in business. KPI software can help you make more informed decisions
3. Measure ROI
In addition to measuring many metrics, Agile KPI dashboards assign a dollar value to each one. The ROI is easily calculated.
4. Save Money
Viewing business performance from all angles helps you see what works and what doesn’t. What fails is discarded and you double down on what works. You save money this way.
5. Optimize Your Funnel
You can easily detect growth opportunities when you have an excellent KPI dashboard at your disposal. Your funnel also needs to have funnel leaks sealed and drop-off points minimized.
6. Make Data-Driven Business Decisions
E-commerce is data-driven these days. You can use a KPI tool to gather a great deal of data from different sources so you can make smart data-based decisions to drive your business forward.
We’ll talk about various dashboard software tools available today now that we know why KPI reporting tools are so important.
Best KPI Dashboard Software & Tools For Creating Dashboard and Reports
We chose 20 of the best solutions on the market for you because choosing the right KPI dashboard for your company can be a daunting task.
1. Scoro
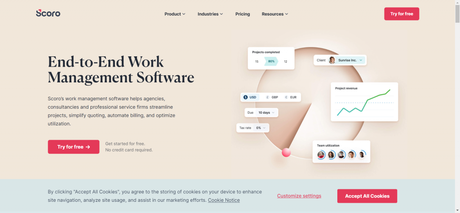
If you are using multiple tools for managing work, tracking finances, planning projects, or compiling reports, then Scoro is the right solution.
It provides an all-in-one solution for all the above tasks pus the real-time tracking/.
Your business KPIs can be tracked in real-time on a Scoro dashboard so you can monitor every aspect of it. Scoro can be integrated with your existing software to track and monitor all your data from one place.
Quick features:
- You can oversee the performance of your company at all levels: projects, budgets, sales, forecasts, team performance, etc.
- It easily tracks your KPIs with unlimited widgets and metrics.
- You can limit access to specific information for each user by setting permissions.
- Trends over time can be observed by comparing two periods.
2. Datapine
Quick Features:
- It provides advanced analytics metrics as compared to Scoro.
- The tool also gives formulas that can be customized.
- You can automate the report generation after a period.
- The tool has various interactive dashboard that gives quick access to any key metrics.
- A neat feature of this tool is that it detects trends and detects new relationships to take the guesswork out of business decisions.
3. InetSoft
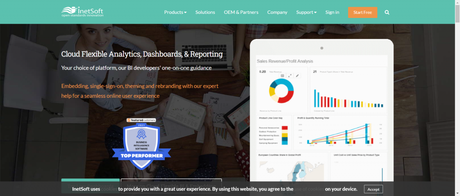
InetSoft is an interesting data mashup tool that gives users fast and flexible data integration from disparate sources, supplementing or obviating the need for a data warehouse.
Inetsoft is specifically built for the SaaS and cloud computing businesses that want to track data between in-house applications and cloud-based applications.
Quick features:
- Modeling atomic data blocks in a professional manner.
- It provides data mashups for end-users on the web
- You would get the dashboards embedded & integrated in applications.
Intesoft has various dashboard visualizations and annotations that makes measuring easier. - It provides a high-end infrastructure that is high-performing and secure.
4. Tableau
Tableau is one of the most popular BI tools that for calculating business KPIs. One of the major reasons for its popularity is a great fit for organizations of all sizes to unlock the power of their most valuable assets: their data and people.
Tableau is a great tool for companies that have clients with a few users and who need to deploy solutions in multiple organizations-but don’t have the infrastructure to set up their own servers.
Quick features:
- Within just minutes, you can add users seamlessly as your needs grow.
- Data can be automatically refreshed from web apps such as Google Analytics and Salesforce.
- It also provides secure access to analytics to external teams, partners, and clients.
- Site admin has the complete control. Users, content, and data can easily be authenticated and accessed by site administrators.
5. SimpleKPI
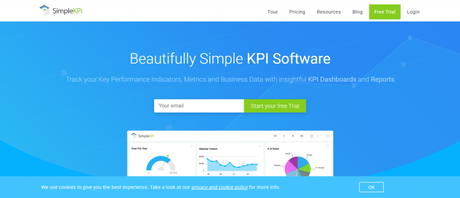
SimpleKPI has all of the tools you’ll need to track and visualise your business data.
It’s jam-packed with simple features that cut down on the time it takes to understand your company’s performance. The cool thing about SimpleKPI is that you can customize your dashboards and reports according to your branding.
Quick features:
- It provides KPI dashboards that are flexible and powerful.
- Simple KPI creates customizable and easy to understand reports even for the newbies.
- Team members can collaborate and share the reports, analytics and even the dashboards.
- Each of the KPI metrics have a streamlined analytics.
6. Smartsheet
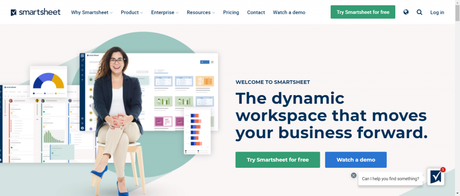
Smartsheet is a dynamic team collaboration software that integrates with apps like Tableau, Excel, QlikSense, QlikView, and others to give you powerful data visualization and insights from your existing tools.
One interesting fact about Smartsheet: it is trusted by more than 50% of Fortune 500 companies.
Quick features:
- If you are collaborating on a specific task, you can share your work with other team members.
- Your team can receive automated alerts about upcoming tasks and approaching deadlines.
- Teams can work, communicate, and collaborate more effectively with a visual representation.
- The project status can be viewed quickly, summary reports on goals can be viewed, and important deadlines can be viewed.
7. Transpara Visual KPI
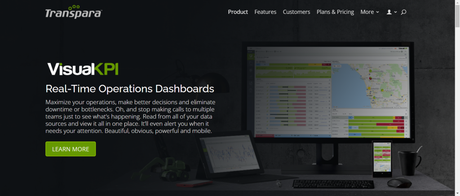
Transpara Visual KPI is a KPI software that connects data in real-time with various members across the organization.
It’s a powerful software for monitoring and managing live operations. It combines thousands of data sources into colourful, easy-to-understand infographics.
From a single location, you can make smarter decisions, minimise bottlenecks, and keep all of your teams up to date.
Quick features:
- This tool is interesting in that it does not require any setup by the user. There is no design involved.
- Transpara picks data from over 50 sources such as browsers, spreadsheets, and big data apps.
- It gives an intuitive drag and drop dashboard builder.
- Transpara KPI works across any device such as tablets, phones, laptops, PC/Mac/Linux.
8. Target Dashboard
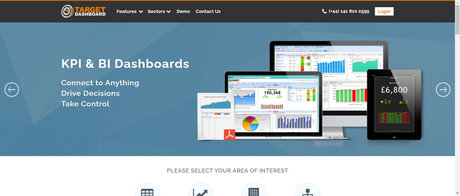
The Target Dashboard brings all of your information together in one location. By delivering vital information and driving growth, it is powerful and proactive.
Quick features:
- A progress email warns of dangers and adds accountability
- The tool is designed to provide mix data from multiple sources.
- Admins can add unlimited users.
- Besides this, you get the ability to modify, re-share, and summarize data.
9. Databox
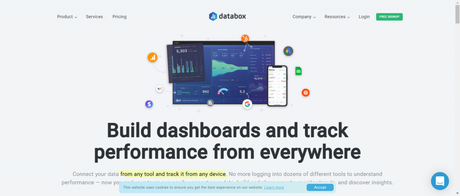
Databox is a real-time business analytics platform that brings all of your data together in one place so you can measure performance and uncover insights.
You can combine data from several sources on a single dashboard to get a more comprehensive picture of your performance at a glance.
Whether in the office, the hallway, or in meetings, Databox gets everyone focused on what matters.
Quick features:
- You can track your progress automatically by setting time-bound, numeric goals.
- No coding is required to create beautiful reports.
- Databox provides an aesthetic and beautifully designed mobile application.
- By automating client reporting, you will save time by no longer cutting and pasting reports, increasing retention, and identifying up-selling opportunities.
10. InfoCaptor
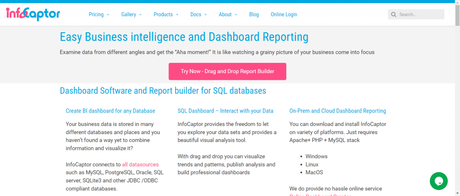
Infocaptor is a popular business intelligence tool and KPI dashboard software designed for SQL databases. InfoCaptor is a very capable software that can handle a wide range of BI Dashboards, data visualisation, and analytics needs for a very low price.
Quick features:
- Infocaptor provides a unique WooCommerce Report plugin.
- The tool comes with various ad-hoc visualizations.
- You can also export the designed dashboards in the PDF or HTML format.
- It also lets you embed dashboards or widgets live on any web page.
11. KPI Fire

KPI Fire simplifies business management rather than overwhelming you with features and complexity. It creates a dashboard in the form of a HuddleBoard that makes business reviews an easy task.
Quick features:
- It ensures employees and projects are aligned with your strategic goals.
- KPI Fire manage projects and show progress in real-time.
- You do not need to download anything to use this app.
- One of the best features of KPI Fire is that it allows you to reward and capture everyone’s ideas.
12. Bright Gauge
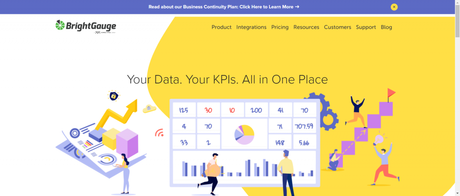
Bright Gauge is a fairly easy to use dashboard that lets you view data from your favorite applications all in one place.
You can create fresh and intuitive dashboards by bringing in all the data and creating the silos at one place.
Quick Features:
- The dashboard provides customizable KPIs that matches with your business needs.
- You can create a separate and shareable client report.
- Using the data mashup, you can see all the KPIs and metrics from your security tools.
- You can calculate each metric by using various operational formulas.
13. Qlik Sense
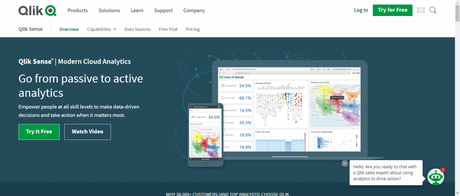
Qlik Sense is a flexible data discovery and visualisation solution that may help you turn large amounts of data into useful business insights.
It’s a cloud-based business platform with an AI associative analytics engine that’s powerful and unique.
Quick features:
- Using a mobile app, you can monitor business KPIs.
- Businesses can leverage it to transfer data from thirs-party sources and utilize them in real-time.
- You can use this interactive dashboard to unpack and expand the specific KPI.
- It provides detailed dashboard monitoring for stakeholders with data-driven metrics.
14. Grow
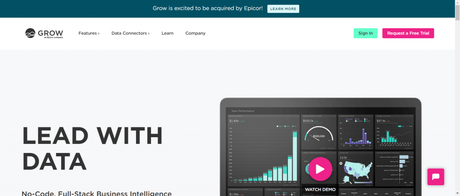
Grow is a reporting and business intelligence dashboard that helps businesses grow faster. It is one of the highest rated BI tool that is designed for businesses of all size.
And, the best part is there is no coding involved.
Quick Features:
- You can access your data through integrations, databases, CRMs, financials, and spreadsheets.
- It lets you add pre-built metrics directly to your BI dashboard by selecting the data you wish to chart.
- You can also refresh your data by setting the Grow timer.
- You can also combine, mix, and compare data from different sources – getting insights tailored to your business.
15. Sisense
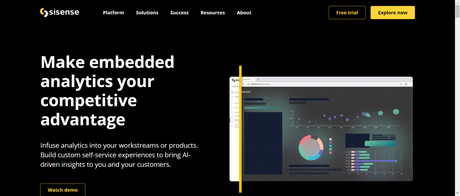
By creating insights from complex data, Sisense helps you maximize business value.
The tool provides an end-to-end platform for complicated data analysis and visualisation that is simple to use. Sisense has a lot of power.
It gathers data from a variety of sources in real time, integrates it, and allows non-techies to create beautiful reports.
Quick features:
- It provides easy creation and management of complex data models from multiple sources using drag & drop.
- Sisense helps you visualize and interact with your data through interactive web dashboards.
- You can also track KPIs that are related to customer service sectors.
- What’s interesting about this tool is that you don’t have to invest in additional tools or specialized personnel in order to prepare, analyze, and visualize complex data with Sisense.
16. Klipfolio
Klipfolio helps you stay informed about your business by allowing you to view your most important data and metrics with real-time dashboards.
It is built and shared using a cloud app on web browsers, TV monitors, and mobile devices.
Quick features:
- Klipfoloio gives direct access to more than 100 cloud apps, including Moz, Twitter, Pingdom, Xero, Salesforce, Google Analytics, among others
- Klipfolio does not require coding knowledge to design your BI dashboards.
- It provides an editor with a powerful data visualization capability.
- Klipfolio gives you deep insights into different departments like sales, marketing, finance and admin.
17. Zoho Reports
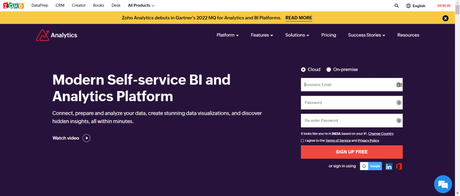
Zoho Reports is an analytics and KPI dashboard software provided by Zoho. You can collect data, analyze it, and generate stunning data visualisations using this KPI dashboard software and visual analytics tool.
The insightful graphical dashboards provide essential insights on your business’s performance and progress.
Quick features:
- You can connect and analyze the data from around 250 sources like web app, and browsers.
- Zoho provides a mobile-friendly and tablet-friendly interface for data visualization.
- It is noteworthy that Zoho Reports adheres to strong Zoho Security Practices, which include support for redundancy, backups, confidentiality and privacy to protect your data.
- You can also create robust reports using its drag and drop interface.
18. Geckoboard
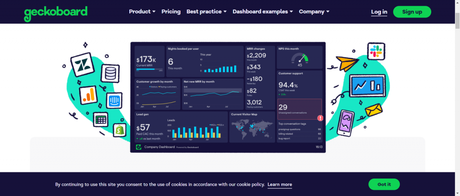
Geckoboard is a KPI dashboard software that creates professional KPIs and real-time interactive dashboards in few minutes.
Using Geckoboard, you can create your own TV dashboard in minutes by dragging and dropping.
Quick features:
- With Geckoboard, you can pull live metrics from popular business tools.
- Geckboard converts the data from Excel or Google sheets into live visualizations.
- You can also visualize metrics from third-party tools and in-house systems.
- You can send an email or chat message that contains a link to your dashboard
19. iDashboards
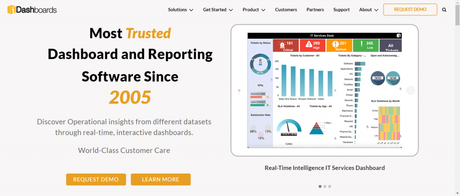
iDashboards is a veteran in KPI dashboard software tools and business analytics. They have clients from over 10 countries. iDashboards offers a drag-and-drop interface that makes it easy to build interactive dashboards.
Quick features:
- You can create intuitive dashboards using charts and graphs.
- The great thing about this tool is that it has real-time email and text alerts, so you can stay on top of your metrics from anywhere.
- You can analyze and mesh the data from over 160 different sources.
- Businesses can even share the reports securely with external stakeholders and team seniors.
20. Dimensional Insights
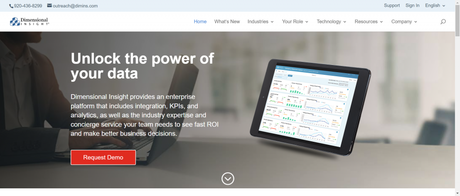
Dimensional Insight is a great product if you’re seeking for an enterprise software platform.
They specialise in enterprise business intelligence software development and marketing. Dimensional Insights offer features like Data integration, KPIs, and data analysis.
Quick features:
- You can utilize this customizable tool by applying the business rules to your data sets.
- There are tons of options and metrics for KPI dashboard creation.
- It integrates seamlessly with tools sales and CRM tools like Hubspot, Salesforce and others.
Conclusion
Here it is!
Our list of best KPI dashboard software and solutions that businesses can use to track and analyze their performance. From web-based to cloud-based, these KPI analytics software come with customizable metrics and reports.
You can choose and pick the one that is best for your needs.
Also Read:`
- Best Digital Asset Management Software for Any Business
- Best Data Modeling Tools To Manage Complex Designs

