Good day all,
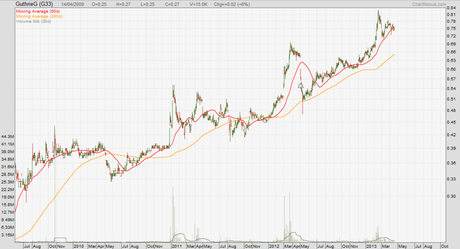
This is Guthrie GTS, G33.SI. Guthrie has been in a very long uptrend coming out of the 2008 crash. This uptrend is very strong, evident by the rising moving averages and price action. Right now, Guthrie is just about trading at all-time highs. Stocks that produce very steady and strong trends leading to an all-time high attract my attention. I have a specific method to trade such a situation.

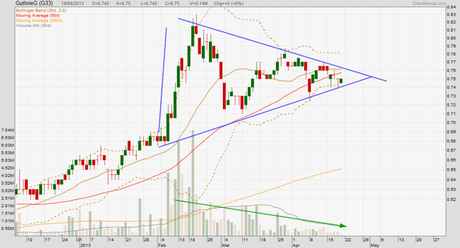
The interesting thing about Guthrie’s chart is that a small pattern has been in the making over the last couple of weeks. After a strong surge in February, Guthrie took a breather and retraced down to the low 70s. Then, it started consolidating in that region – also flirting with the 20-day moving average. The recent price action brings about a small symmetrical triangle. It is still an unconfirmed one with no breakout in sight. I like volume behaviour – huge at the beginning of the triangle before tapering off in the formation of the triangle. All that is left is for a breakout.

All analyses, recommendations, discussions and other information herein are published for general information. Readers should not rely solely on the information published on this blog and should seek independent financial advice prior to making any investment decision. The publisher accepts no liability for any loss whatsoever arising from any use of the information published herein.
