Good day traders,
As the market would have it with me so often, the exact opposite of my sentiment usually happens. Ever since my last post, indices around the world have rallied hard. The sharp devaluation gave long-term players an opportunity to snap up bargains on the market. As we cross over to the latter half of the year, indices are either at or above their 200-day moving averages, and having made higher highs and higher lows after the scare in January. Unsurprisingly, price action over the last few months have developed a bottoming pattern of sorts: specifically, unconfirmed, inverted head-and-shoulders patterns are showing up on many charts. It may be a case of the breakdown from large, upright head-and-shoulders patterns resulting in a consolidation instead of further downside.
With every wek and month of upside, it does dent my confidence of the longer-term decline I am expecting. Being a long-term player is analogous to a huge ship's maneuverability compared to a small speedboat: I cannot and will not change my outlook until way past the bottom. It is tempting to switch from a bearish to a bullish outlook now but I am still not convinced with the recent rally.The dilemma I face now is because of the presence of dynamic patterns that are suggesting upside to come. I use the term dynamic pattern to mean general price patterns that have a particular shape in recent history - these patterns do not have conventional names like the head and shoulders and others; or they may but with a certain "twist." I will illustrate what I mean in the charts below.
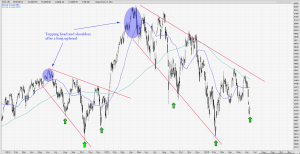
The first chart is of the CAC 40. The turbulence late in 2014 produced a descending, broadening wedge pattern, which also turned out to be a inverted head and shoulders. Early in 2015, the market took off and the CAC 40 blasted off to new, major highs. Now, steer your eyes to the right half of the chart, and you will see a similar phenomenon. It is not so much the small, topping head and shoulders that matter but the similarity between the two huge, descending, broadening patterns. I have veered away from trading patterns in recent years but it is magnificent to see such huge patterns unfold, and even more important to gauge their sucess rates. Ditto for the STI and Hang Seng Index- albeit making reference to an inverted head and shoulders in 2011-2012.
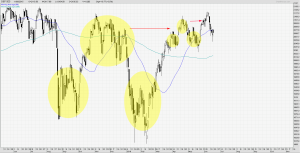
Moving on, I have the Dax. The dynamic pattern in the Dax starts with a good, long uptrend before a downward-biased contractional period. Then, price moves down in a classical a-b-c Elliot Wave retracement pattern. In this dynamic pattern I am identifying, the Dax then goes up and congests for a little while before flying up and away. Now, look to the right half of the chart, and see if you agree with my judgment of the same phenomenon brewing. With such beauty in the charts, how can I ignore the case for upside?
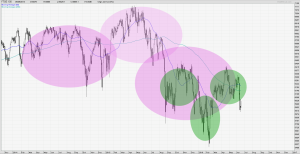
The next chart is of the S&P 500. Bear in mind that I have highlighted the presence of a general, large, rounding pattern - a stalling in the long-term, multi-year bull run. Within that large pattern is wht we now see as a clearly-defined head and shoulders with a right shoulder breakout upwards some time in March of this year. Price is currently testing the head region. Take note of the smaller head and shoulders that is also undergoing a head test now. In this case, this dynamic pattern does not indicate anything since the head test is still ongoing.
In the next few charts - FTSE 100, Hang Seng, and Russell 2000, you will see what I mean by the large, rounding, topping patterns strting to give way to what seems like a reversal, inverted head and shoulders. It is certainly not the first time I see such a phenomenon but my experience tells me it is ust about fifty-fifty where the market will head to next. Sometimes it carries on higher and proves the inverted head and shoulders to be correct - rendering the earlier head and shoulders to be invalid, or the market dives lower and proves the inverted head and shoulders (usually the smaller of the two) to be a false reversal indication. Tough call is it not? Such is the market!
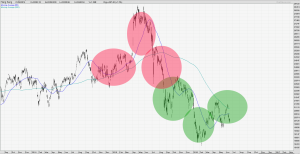
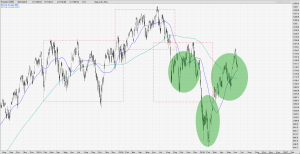
All in all, I am still wary of the multi-year bull run that has lost some steam in the last 2 years because the looming, gravely topping pattern is still intact; however, there could be short-term plays to the upside.
All analyses, recommendations, discussions and other information herein are published for general information. Readers should not rely solely on the information published on this blog and should seek independent financial advice prior to making any investment decision. The publisher accepts no liability for any loss whatsoever arising from any use of the information published herein.This entry was written by , posted on June 20, 2016 at 11:53 PM, filed under International and tagged broadening decending wedge, CAC 40, Dax, descending broadening wedge, FTSE 100, German Dax, Hang Seng, Hang Seng index, head and shoulders, inverted head and shoulders, Russell 2000, S&P 500. Bookmark the permalink. Follow any comments here with the RSS feed for this post. or leave a trackback: Trackback URL.
