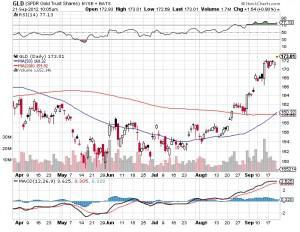
$GLD Gold Chart Technical Analysis – Golden Cross 2012.09.21
Gold has had 12 other golden crosses take place since 1976, according to market-research firm Bespoke Investment Group. After a cross occurs, gold has averaged a 1% decline over the next week. One month later, the precious metal has averaged a 2.5% drop.
Gold’s most recent golden cross occurred in February 2009. The precious metal rose 3.4% one week later, but it registered a 5.1% loss in the course of a month and a 3.5% decline throughout a three-month timeframe.
In other words, a short-term pullback following gold’s latest rally wouldn’t come as a total shock.
WSJ Morining MarketBeat
