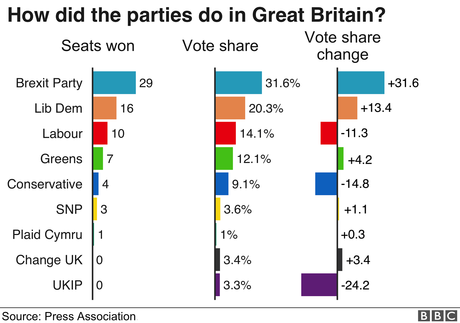
From the BBC:

Leavers: Brexit Party got far and away the most votes and seats, so we won.
Remainers: Ah, but if you add the votes of the hard remain parties (Lib Dems, Greens, SNP, Plaid Cymru and Change UK), we won.
[Let's skip the debate about whether votes for the Conservatives or Labour are proxy votes for Leave and Remain respectively, Lord Ashcroft's polls say that the number one reason that people voted for those parties was 'Because I always do.'
Leavers: Ah, but lots of people would have voted Lib Dem, Green etc anyway, regardless of their EU policies.
Remainers: So let's look at the swing. Total Hard Leave (Brexit Party/UKIP) only up 7.4% compared to the 2014 elections, and the total vote share of Hard Remain parties (list as above) up by 22.4%. The net shift from Conservative/Labour to Hard Leave was 7.4% and from those two to Hard Remain was 22.4%. [Yes, those shifts add up to 29.8% and BBC give combined losses for Lab/Con as 26.1%, not sure where the other 3.7% came from]. That's a significant swing to Hard Remain.
Leavers: Hang on, weren't you moaning after the Referendum that with a 52%/48% result on a 72% turnout, strictly speaking only 37% voted to Leave and 63% didn't. This this time Hard Remain got 40% on a laughably low turnout of 37%, that means only 15% voted to Remain, which is a lot less than 37%.
Remainers: So why are you lauding Brexit Party's votes; they got 32% of 37%, that's only 14$%, hardly a mandate for a No Deal Brexit. Of 17.4 million people who voted Leave back in 2016, only 5.2 million voted Brexit Party, clearly 12 million of them have lost interest.
[And so on, ad infinitum].
