Here’s another great guest post by Megan Evans of UQ – her previous post on resolving the environmentalist’s paradox was a real hit, so I hope you enjoy this one too.
–

Threat knowledge
Conditions such as cancer, heart disease and mental health are regarded as National Health Priority Areas in Australia, and have been given special attention when prioritising funds since the late 1980s. The burden of disease in these priority areas are quantified according to the incidence or prevalence of disease or condition, and its social and economic costs. Estimates of burden of disease and their geographic distribution (often according to local government areas) can assist in communicating broad trends in disease burden, but also in prioritising efforts to achieve the best outcomes for public health. An approach similar to that used in healthcare could help to identify priorities for biodiversity conservation – using information on the species which are impacted by key threats, the spatial distributions of species and threats, and the costs of implementing specific management actions to address these threats.
In a study recently published in BioScience1, we examined in detail the threats reported for threatened species listed under the Environmental Protection and Biodiversity Conservation Act 1999 (EPBC Act). We first calculated the percentage of threatened species affected by eight key threats:
- habitat loss
- introduced species
- inappropriate fire regimes
- disease
- pollution
- overexploitation
- native species interactions, and
- natural causes.

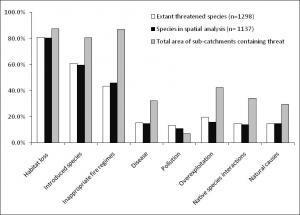
Figure 1. Relative impacts of major threatening processes expressed as the % of extant species threatened, the % of mapped species threatened (subset of extant threatened species for which spatial data were available), and the % of continental area of Australia across which the threat occurs within sub-catchments.
From this we were able to confirm that habitat loss is the most important threat to Australian biodiversity, affecting 81% of threatened species (Figure 1). However, we also found that changes to the natural fire patterns and introduced species threaten proportionally more species in Australia than in other countries including the United States of America, Canada and China.
Reporting on statistics such as these can be useful for making broad comparisons in the relative importance of threats, or to communicate better the dire situation facing Australia’s biodiversity – but the value of such analyses in informing practical efforts to conserve threatened species can be limited. One important reason for this is that the distribution of threats and species vary across the landscape. To become useful in conservation planning, we need to quantify threats spatially.
Which species, where?
To do this, we used species distribution models from the Species of National Environmental Significance database, and matched the listed threats for each species to their corresponding spatial models. From this we determined which of the 62,629 sub-catchments across the Australian continent contained species affected by each threat.

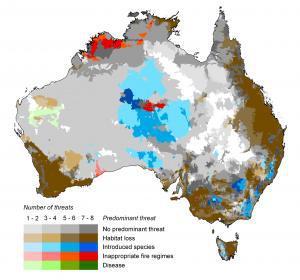
Figure 2. Distribution of the predominant threats to biodiversity across Australia. The ‘predominant threat’ is the threat affecting the greatest number of species in each sub-catchment. Where 2 or more threats affect an equivalent number of species, we assume no predominant threat occurring in these sub-catchments (shades of grey). Darker colours indicate a larger overall number of threats occurring in the sub-catchment. White indicates areas where no threatened species occur.
Our first effort revealed important connections between the distributions of species and threats. For instance, changed fire patterns are a threat to species across almost 90 % of the Australian landscape, but affect less than half of the threatened species. We then calculated the proportion of species affected by each threat contained within each sub-catchment, and subsequently determined the predominant threat in each sub-catchment. From this it became clear that multiple stressors are impacting native biodiversity over much of the continent (Figure 2) – even in regions sparsely populated by humans such as northern Australia.
This means that effective conservation management is critical even in areas considered to be wilderness. Our study has shown that the majority of Australia’s threatened species are affected by multiple pressures (over 75% of species), and these threats are distributed across most of the continent – many of which cannot be eased through the protection of habitat alone4. This is an important result – as it means that getting the best outcomes for biodiversity requires a broad understanding of factors to decide best direct conservation efforts: what threats exist, what are the potential benefits of conservation management, what are the most suitable management actions and how much will they cost?
What’s the priority?
The next step in this research is to understand how we can effectively prioritise resources to maximise conservation outcomes where a range of threats to biodiversity exist. We pursued this by developing a multiple-action, return-on-investment framework3. Similar approaches have been used to determine what conservation management actions to do, where and when – but so far, a lack of information on the threats to species and their spatial distributions means that the additional complexity of how to address the impacts of multiple threats on species has not yet been considered.
There are two possible consequences of ignoring the issue of multiple threats: first, the benefits of abating a single threat may be overestimated because species might be threatened by multiple processes; second, the cost of abating two threats in one place might be cheaper than the sum of the costs of abating each threat alone.
We tested our approach by considering two key threats to Australian biodiversity: the red fox and the European rabbit. Some species are threatened only by foxes, some only by rabbits, but some are affected by both – and so require management actions directed at both threats in order to persist. Using spatial data on the distributions of threatened species, and of the two introduced species, we calculated the area within each of Australia’s bioregions requiring management for foxes rabbits, or both. We then tested four return-on-investment frameworks (Figure 3).

Figure 3. Investment into conservation actions at a continental scale for all 72 bioregions, according to our 4 return-on-investment (ROI) frameworks: (a) Two-action-independent ROI, (b) three-action-independent ROI, (c) action-dependent ROI and (d) action-dependent ROI with spatial targeting. Map shows the priority bioregions for investment as indicated by the total percentage of funding for a bioregion summed over all actions, which is shown as low (up to 1%), medium (up to 2%) or high (up to 6%).
The first ignored the presence of more than one threat on threatened species. In this case, it was best to spend the majority of funds over all bioregions (68 %) on rabbit control – as many more species are threatened by rabbits than foxes. Our second method considered species impacted simultaneously by both foxes and rabbits, but ignored the benefits of integrated fox and rabbit control to species affected by only one of the threats. In this case, rabbit control was still the best option (receiving 62 % funds overall).
But when we fully considered the management requirements of species affected by multiple threats, as well as the benefits of integrated management for species only affected by one threat, we found that 96 % of the total funds were allocated to integrated management of foxes and rabbits. In short, fully accounting for the potential to implement integrated management actions that address more than one threat to biodiversity resulted in improved cost efficiencies and better conservation outcomes.
Our final analysis investigated whether detailed information on the spatial overlap of species’ distributions within each bioregion influenced the timing or amount of investment directed to management. For example, a bioregion where species are more densely concentrated than others might provide a greater return with targeted investment in conservation. However, we found that accounting for spatial overlap in the distributions of threatened species did not alter the prioritisation of funds to alternative management actions or locations (Figure 3d).
This suggests that refined data on distributions of threatened species might not improve our ability to determine where and when funding should be directed to conservation actions to mitigate specific threats to biodiversity. Our research suggests that efforts to prioritise conservation investments would be improved by gaining better information on the specific threats impacting on species, the distribution of these threats and the costs of management actions.
In a time when getting conservation outcomes through wise investments is crucial, we should also focus on gaining a greater understanding of the efficiencies gained through integrated management, and the institutional structures that facilitate this.
Megan Evans
–
References
1Mitchell, R. J., R. J. McClure, J. Olivier, and W. L. Watson. 2009. Rational allocation of Australia’s research dollars: does the distribution of NHMRC funding by National Health Priority Area reflect actual disease burden? The Medical Journal of Australia 191:648-652
2Evans, M. C., J. E. M. Watson, R. A. Fuller, O. Venter, S. C. Bennett, P. R. Marsack, and H. P. Possingham. 2011a. The spatial distribution of threats to species in Australia. BioScience 61:281-289. doi:10.1525/bio.2011.61.4.8
3Evans, M. C., H. P. Possingham, and K. A. Wilson. 2011b. What to do in the face of multiple threats? Incorporating dependencies within a return on investment framework for conservation. Diversity and Distributions 17: 437-450. doi:10.1111/j.1472-4642.2011.00747.x
4Watson J.E.M., Evans M.C., Carwardine J, Fuller R.A., Joseph L.N., Segan D.B., Taylor M.F.J., Fensham R.J., Possingham H.P. 2011. The capacity of Australia’s protected-area system to represent threatened species. Conservation Biology 25: 324-332. doi:10.1111/j.1523-1739.2010.01587.x

Megan C. Evans, James E. M. Watson, Richard A. Fuller, Oscar Venter, Simon C. Bennett, Peter R. Marsack, & Hugh P. Possingham (2011). The spatial distribution of threats to species in Australia BioScience, 61 (4), 281-289 : 10.1525/bio.2011.61.4.8

