By 2008 that percentage had grown to 40%.
 From 2008 to 2013, under the regime of President Lucifer, abortion mills have risen to a near governmental power, and are being actively promoted in the public schools.
The following article can be read at: http://www.johnstonsarchive.net/policy/abortion/uslifetimeab.html
Percentage of United States women who have had abortions
compiled by Wm. Robert Johnston
last updated 15 October 2008
Summary: It is estimated here that, as of 2008, about 28% of U.S. women ages 15-64 have had abortions. This figure has risen from 2.8% in 1973 to 11% in 1980, 19% in 1987, 24% in 1994, and 27% in 2001. In 2008, of women ages 40-55, about 40% have had abortions in their lifetimes.
From 1967 to September 2008, approximately 50,200,000 abortions occurred in the United States; of these, about 30,260,000 or 60% were to women with no prior abortions [1,2]. In other words, 30,260,000 different women had one or more abortions from 1967 to the present in the U.S.
Given that there were 101,314,000 women ages 15-64 in the U.S. in 2007, this implies about 25-28% of women ages 15-64 in the U.S. today have had at least one abortion in their lifetime. The uncertainty stems from unaccounted-for factors such as mortality among older women, women who have immigrated into the U.S. in this time period, U.S. women who obtained abortions abroad, and abortions obtained in the U.S. by women from other countries. (This discussion only includes legal abortions; illegal abortions prior to the 1970s were probably in numbers small enough not to significantly affect the final results.)
These statistics are reported by the Alan Guttmacher Institute:
- “… roughly one-third of women will have an abortion during their reproductive lifetime…” (2008) [1]
- “… of American women … at current rates more than one-third (35%) will have had an abortion by age 45.” (2008) [3]
- “… of women aged 15-44 … 30% have had an abortion.” (1992 figures) [4]
The following data are based on a model incorporating data from a 2008 Alan Guttmacher Institute release [1], reporting 1973-2004 figures based on their periodic surveys of abortion providers (these surveys are widely accepted as the most complete data available on U.S. abortions), supplemented by CDC and other data for 1967-1972 [2] and estimates for 2005-2008.
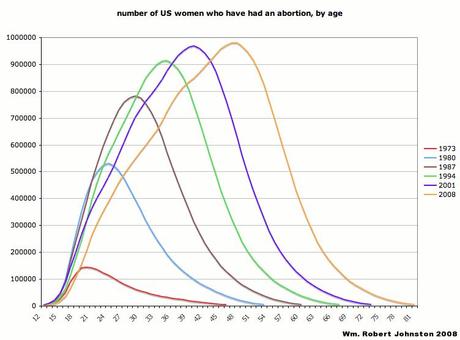
The graph below shows estimated number of U.S. women who have had abortions by age. The annual number of abortions in the U.S. peaked in 1990, although the abortion rate per 1000 women aged 15-44 peaked earlier, in 1980. This abortion rate has dropped from 29.28 in 1980 to 19.41 in 2005, representing a variety of factors but likely including a shift in attitudes towards abortion. The peak in the graph has shifted with the aging of those women who obtained abortions in the 1980s.

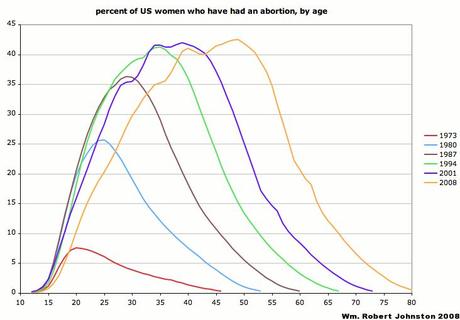
The next graph shows the estimated percentage of U.S. women who have had abortions by age. Again, it shows the aging of women who obtained abortions in the first 15-20 years after Roe v. Wade and the more recent drop in abortion rates among women under 25. Consequently, the fraction of 25-year-old women who have obtained abortions has dropped from 32% in 1980-87 to 26% in 2001 and 21% in 2008.

The following table gives estimated percentages of U.S. women who have ever had abortions by age ranges–note that these percentages are approximate. Nonetheless, both the prevalence and the shifting demographics of abortion is evident. (One issue is the health implications of a large aging population who have obtained abortions in the past–for example, given the possible link between induced abortion and breast cancer.)
year estimated % of US women who have had abortions by age range
12-80 15-64 12-19 20-29 30-39 40-49 50-59 60-69 70-79
1973 2.3 2.8 2.7 6.2 2.7 0.6 0.0 0.0 0.0
1980 9.0 11.1 6.1 23.3 13.5 4.4 0.3 0.0 0.0
1987 15.2 18.6 6.2 30.6 29.6 12.2 2.6 0.1 0.0
1994 19.8 24.4 4.6 30.4 39.8 25.8 8.6 1.3 0.0
2001 22.3 27.0 4.8 26.6 40.0 36.9 16.6 4.8 0.3
2008 24.3 28.6 2.3 19.3 35.0 41.2 34.6 14.3 3.4
A 1998 study by Henshaw [4] included a more sophisticated analysis than the one above; for 1994, here are a comparison of percentage of women who have had abortions by age range from Henshaw and from this analysis–to give some indication of the uncertainty in the figures above.
year estimated % of US women who have had abortions by age range
15-19 20-24 25-29 30-34 35-39 40-44
1994, Henshaw 7.0 26.3 37.3 40.2 38.3 25.0
1994, this analysis 7.2 24.9 35.5 39.8 39.8 31.2
Some published analyses similar to (but more sophisticated than) the analysis above:
- United States: Henshaw, Stanley K., 1998, “Unintended pregnancy in the United States,” Family Planning Perspectives, 30(1):24-29, 46.
- Australia: Chan, Annabelle, and Rosemary J. Keane, 2004, “Prevalence of induced abortion in a reproductive lifetime,” American Journal of Epidemiology, 159(5):475-480.
References:
- Henshaw, Stanley K., and Kathryn Kost, August 2008, “Trends in the characteristics of women obtaining abortions, 1974 to 2004,” Guttmacher Institute, on line [http://www.guttmacher.org/pubs/2008/09/18/Report_Trends_Women_Obtaining_Abortions.pdf].
- Johnston, W. R., 4 June 2008, “Historical abortion statistics: United States,” on line, Johnston’s Archive [http://www.johnstonsarchive.net/policy/abortion/ab-unitedstates.html].
- Alan Guttmacher Institute, Jan. 2008, “An overview of abortion in the United States,” Guttmacher Institute, on line [http://www.guttmacher.org/media/presskits/2005/06/28/abortionoverview.html].
- Henshaw, Stanley K., 1998, “Unintended pregnancy in the United States,” Family Planning Perspectives, 30(1):24-29, 46.
© 2008 by Wm. Robert Johnston.
Last modified 15 October 2008.
Return to Home. Return to Other Policy Issues. Return to Abortion Statistics.

