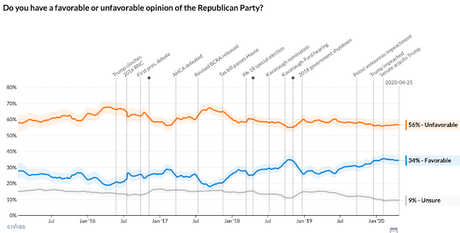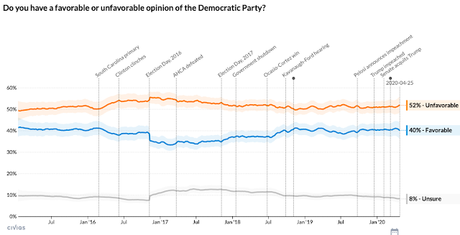

The charts above are from the Civiqs Poll. It shows the registered voters' perceptions of the Republican and Democratic parties. They questioned 335,117 registered voters between January 15th and April 25th of this year.
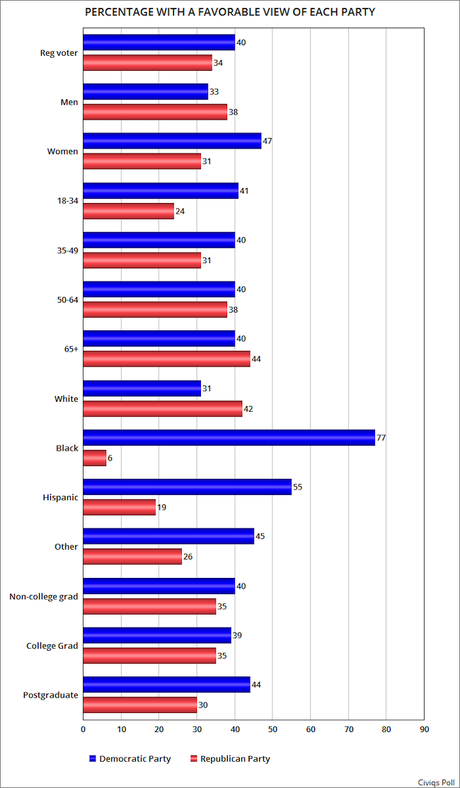
The public is not enamored with either political party, but they give the Democrats a better net rating (-12 points) than the Republicans (-20 points). Currently, 34% have a favorable view of the Republican Party while 40% have a favorable view of the Democratic Party.
The chart below shows how the different demographic groups view the two parties.


