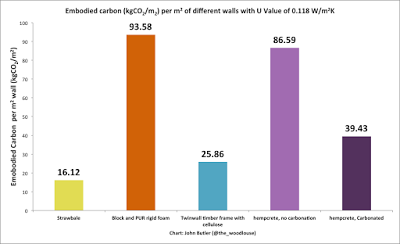
Earlier this week I posted this chart on twitter, showing the carbon emissions resulting from the production of one square meter of some different walls.
click for full-size image
It’s been generating some interest, not least from those very sensibly wanting to see the calculations that led to it. The chart came from a talk I gave last week on embodied carbon in building materials, part of West Dorset Open EcoHomes. This blog is a combination of some of the main points from my talk, and an explanation of how I arrived at the chart above. For each section I’ve put key points first, with more-detailed explanation of the calculations and data second. Those that are interested can look at them, but anyone who doesn’t want the detail can scroll past it to the next bit. I’m very interested to see whether my figures and calculations stand up to scrutiny – please do critique and correct them via the comments box at the bottom.
This is a bit of a long blog.
Two things have emerged repeatedly during the last year on the awesome MSc Sustainability Adaptation and the Built Environment, at Centre for Alternative Technology:
- The interconnectedness of all things
- It's complicated
Many things affect what is or isn't a sustainable material. The choice must be the best balance of them all. There are a few key factors. Sustainable materials should minimise energy use and extraction of raw materials, and maximise potential for reuse or recycling [1]. Energy use is important mainly because of the carbon emissions associated with it.
Embodied energyBuildings contribute to energy use during production of materials, operation (mainly heating and cooling), and deconstruction [2,3]. The energy used to extract, process and transport raw materials is their embodied energy [4,5]. The CO2 released by production of that energy is their embodied carbon.
As buildings become better insulated, more airtight, and generally more energy efficient, the importance of embodied carbon increases [6]. It is important to reduce energy use (and associated CO2 emissions) in both production and use of buildings by using materials with low embodied-carbon, which also provide high levels of insulation.
If that can be done using materials which use minimal non-renewable resources, and which have least toxic pollutants associated with their production, then all the better.
Embodied CarbonSo, embodied carbon refers to the CO2 emissions resulting from production of a material. It’s expressed as kg of CO2 per kg of material: kgCO2/kg, sometimes given as kgCO2e/kg – the ‘e’ means ‘equivalent’ meaning other greenhouse gases are included, represented by the amount of CO2 that has an equivalent contribution to global warming potential [7].
That chart above shows my calculation of the embodied carbon per square meter of four different wall systems, each providing the same level of insulation (U-Value 0.118 W/m2K – slightly arbitrary but chosen to match the U-value of my own strawbale walls). I find it more useful to compare embodied carbon this way as it relates to the amount of materials used, and accounts for density. Some materials may have high-embodied carbon per kg, but if that material is light then not many kg of it will be used.
A brief note on calculations.
After calculating the thicknesses of each insulation material needed to reach the same U-Value, I worked out the volume of all the different materials in each wall. From this the embodied carbon per m2 is calculated as follows
1. Volume of material in one m2 of wall (m3) x density of that material (kg/m3) = weight of material in one m2 of wall (kg/m2).
2. Weight of material in one m2 of wall (kg) x embodied carbon of that material (kgCO2/kg) = embodied carbon per m2 (CO2/m2)
3. Adding together the CO2/m2 of each material gives the total embodied carbon per m2.
Embodied carbon, density, and some thermal conductivity data is taken from the Inventory of Carbon and Energy [8]. This is a brilliant resource, with data sourced from peer-reviewed studies. There already some newer materials which aren’t covered, but a huge range are.
Four walls
The four wall-types are used as examples to illustrate the differences in embodied carbon of different materials. I’m hoping they represent a sample of conventional and sustainable building methods.I’ve factored in the main materials in each wall type, but have had to make some assumptions (eg: number of studs in timber frame wall), and have excluded fixings (screws, nail-plates, nails, wall-ties etc). A key omission in the U-value calculations is thermal bridges, which – frankly – I’ve ignored. I just wanted accurate-enough data to explore and compare embodied carbon in a meaningful way, but there is a limit and I should be writing my dissertation (funnily enough, about timber thermal bridges in strawbale buildings).Given the identical U-value, each wall-type should produce a building with identical operational energy (differing thermal mass will have some impact on this, but that’s beyond my ability to calculate), with the differing levels of embodied carbon being the significant variable in lifetime carbon emissions.
Strawbale
click for full-size image
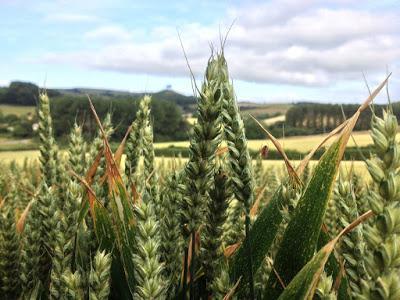
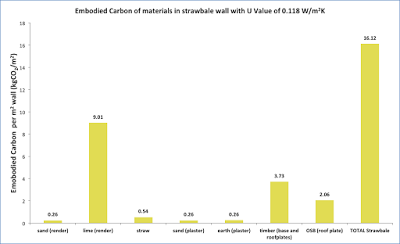
First up, a loadbearing strawbale wall. The calculations include timber used in base and wall plates, internal earth-sand plaster and external lime-sand render.
click for full-size image
What surprised me about this was the amount of carbon relating to lime – this makes up a quarter of the render, which is a 30mm layer on the wall, yet is by far the biggest contributor to the embodied carbon of wall. This begins to suggest that lime is not a low carbon material, though it is still a lower-carbon alternative to cement for situations where a hardwearing cementitious substance is needed. The embodied carbon of lime is 0.78 kgCO2e/kg; cement is 0.95 kgCO2e/kg. Lime is also less dense, reducing embodied carbon per volume, compared to cement. More on lime (including possible re-absorption of CO2) later.
The straw (acting as insulation and structure) is the biggest part of the wall by volume, but still the second-lowest contributor to embodied carbon.
Straw is annually-renewable, the waste stalks left from grain production.
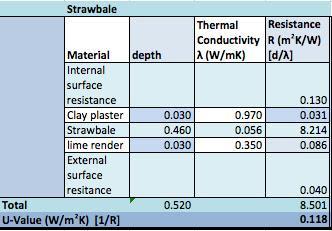
Techie bitHere’s the u-value calculation, also indicating the thicknesses of different materials.
click for full-size image
The thermal conductivity value for straw bale is a median of figures from Wimmer et al (2000) [9] and Goodhew and Griffiths (2005) [10].
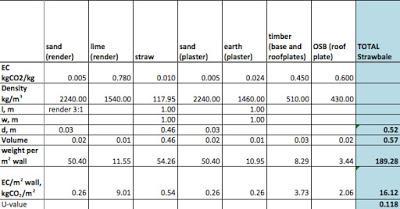
Here’s the spreadsheet with volume, weight and embodied carbon figures. See above for calculations used, as I forgot to add them visibly to the spreadsheet (if anyone really wants to check my figures I’m happy to email the spreadsheet).
click for full-size image
Timber and OSB volume is based on detail drawings from Straw Works for base plate and roof plate. Volume of timber in linear meter of each, totalled then divided by two, assuming room height of at least 2 m (rough and ready calculation but hopefully close to reality).
Bale density is derived from the median weight and size of a construction bale in Jones (2009) [11]: 20.5kg, size 1.05 m x 0.36 m x 0.46 m
Brick, block and polyurethane (PUR)This is still the most common conventional building technique, though the thickness of insulation here is probably much greater than in standard builds.
click for full-size image
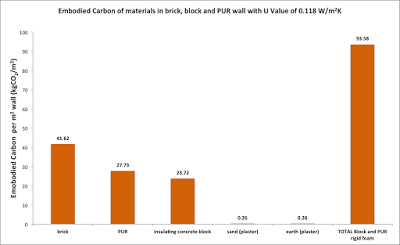
I was expecting a high figure for the PUR (oil-based) insulation, but was shocked by the high-embodied carbon of the bricks – production of one m2 of standard brick wall causes 41.62 kg CO2 emissions. That excludes the mortar, which I failed to calculate. Hard to escape the conclusion that bricks should be avoided! On the other hand, if built with lime or other relatively-soft mortar that allows the bricks to be separated at the end of a building’s life, then bricks can be reused repeatedly, which would share their embodied carbon over the lifetime of several buildings.
The PUR board is a big contributor to the embodied carbon of this building system, as are the insulating concrete blocks. Having just looked at Kingspan and Celotex websites, it seems PUR board is being replaced by PIR (polyisocyanurate) or phenolic foam board, which may have different embodied carbon to PUR (ICE database doesn’t list them, but Greenspec lists PIR and PUR as having the same embodied energy).
This wall system is composed entirely of non-renewable resources, though some materials can be reused.
I’ve been “kind” to this wall by giving it low-embodied carbon earthen plaster on the inside, which hasn’t made much impact on the total embodied carbon.
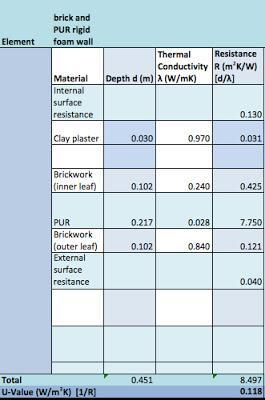
Techie bitU-value calculation
click for full-size image
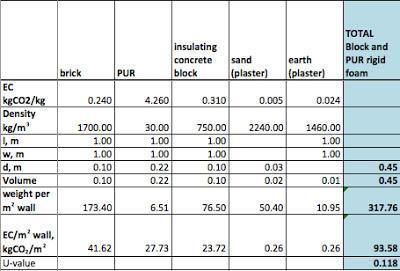
Embodied carbon calculation
click for full-size image
Calculations exclude mortar in brick and block walls.
Twinwall timber frame, cellulose fiber insulation
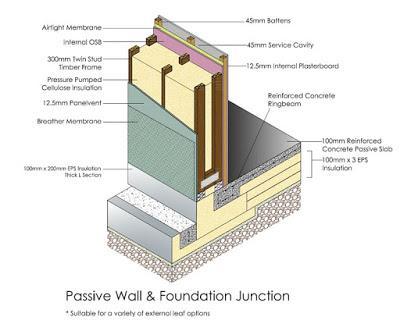
Image source: MBC Timberframe [12]
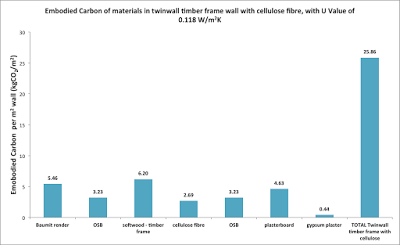
click for full-size image
Embodied carbon contributions are more evenly spread amongst the components of this wall, with plasterboard and cement-sand render being the largest individual contributors. Overall I think this wall performs well for sustainability. It has much lower embodied carbon than the brick/block wall, and although higher carbon than strawbale, still has a high proportion of renewable materials in timber and cellulose fiber (which is made from recycled newspaper).
Techie bitU-Value calculation
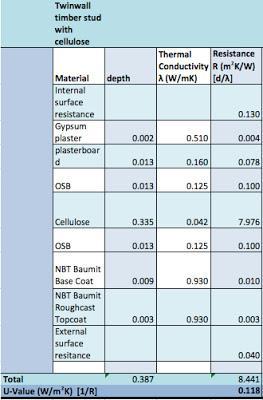
click for full-size image
Embodied carbon calculation
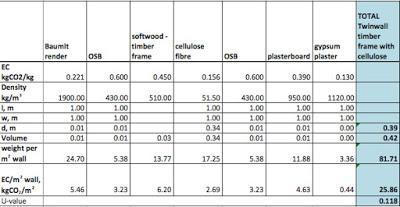
click for full-size image
In calculating timber volume I’ve assumed two uprights per m2 (500mm centres), which makes four uprights, each 100 mm x 50 mm x 1000 mm (0.005 m3 x 4 = 0.02 m3), plus four noggins, each 100 mm x 50 mm x 100 mm (0.0005 m3 x 4 = 0.002 m3). Service cavity has another two uprights, 1000 mm x 50 mm x 50 mm (0.005 m3 total).
Cellulose fiber density and embodied carbon figures are the medians of figures from two Environmental Product Declarations for cellulose fiber [13,14].
Hempcrete
click for full-size image
Hempcrete is chopped hemp stalk mixed with a lime binder. To make sense of the charts here a brief explanation of building lime is needed, in particular the lime cycle. To produce building lime as lime-putty, limestone is burned, driving off carbon (as CO2) and converting Calcium Carbonate into Calcium Oxide. This is then reacted with water to form Calcium Hydroxide – lime putty. Lime putty is mixed with aggregate (e.g. sand or hemp), and as it cures it recombines with carbon from the atmosphere (CO2) to form Calcium Carbonate again. In theory – if fully carbonated – cured lime has reabsorbed all the CO2 that was driven off during it’s production, but not any CO2 emitted by burning the fuel used to heat the lime the first stage of the cycle.
Another kind of building lime is Natural Hydraulic Lime (NHL), made by burning limestone that contains impurities. NHL sets faster than lime-putty, and though it still re-carbonates does not do so to the same degree as lime-putty.
Pozzolans (crushed brick or calcined china clay) can be added to lime-putty to encourage a faster set, similar to NHL.
Chalk (limestone), click for full-size image
Why is this relevant? The carbon driven off during the burning of lime is included in the embodied carbon figure for lime, so it’s reabsorption by curing lime should be included in calculation of total embodied carbon for walls using lime. There’s a very big but here: that assumes 100% re-carbonation, which is unlikely. Most commercial hempcrete is made using NHL, which doesn’t recarbonate as well as hempcrete made using lime-putty, even if the lime-putty has pozzolan added [15].
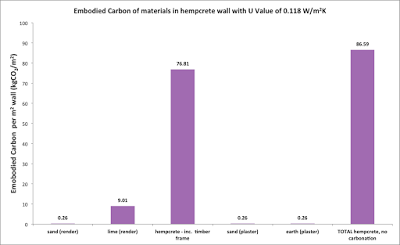
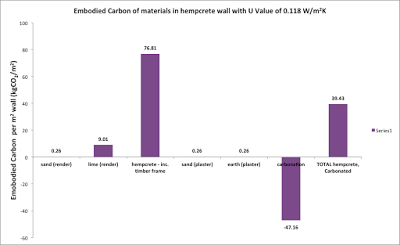
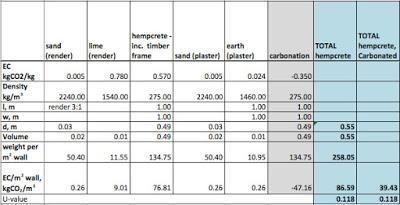
I’ve calculated the embodied CO2 of hempcrete walls for two cases, one with no carbonation, and one with 100% carbonation. Neither is an especially likely scenario – the truth is probably somewhere in between.
click for full-size image
click for full-size image
These results surprised me. Even if the lime has 100% re-carbonated (second chart), the total embodied carbon from a lime-rendered hempcrete wall is second only to the block and PUR wall. Hempcrete is often touted as a highly sustainable material, but now I’m not so sure. In its defence, the use of non-renewable resources is limited to the lime, with hemp being a fully renewable crop.
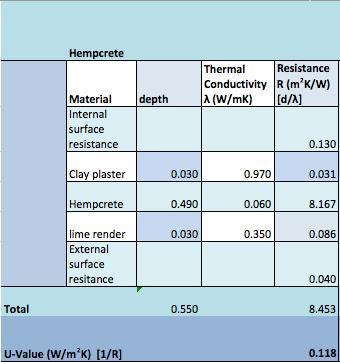
Techie bitU-value calculation
click for full-size image
Thermal conductivity from [16].
Embodied carbon calculation
click for full-size image
Density, embodied carbon, and carbon reabsorption data derived from [17] (which includes timber frame but excludes render, which I’ve added).
Transport
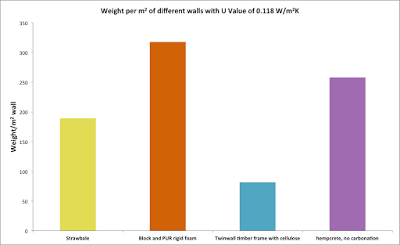
Transport emissions have a major impact on embodied carbon. The chart below shows the weight per m2 of the four wall systems. I haven’t calculated the transport emissions, but they will be greatest for the heaviest materials, if hauled the same distance (the heavier the load – the greater the amount of fuel needed to haul it).
click for full-size image
The twinwall timber frame with cellulose insulation starts to look pretty good here. The light weight of the system means its transport emissions will be lower, if hauled the same distance as the other systems. Hempcrete is not looking so good here – it’s heavy! The combined materials of a strawbale wall are quite heavy too, though only second-heaviest.
A key factor for transport emissions is distance. Greater distances incur greater transport emissions. With any of the wall types, embodied carbon can be reduced or increased by shortening or lengthening the distance from source to site of use.
Carbon storage (sequestration)
There is an argument that in addition to having low-embodied CO2, straw and hemp (and other crop-based building materials) can help reduce atmospheric CO2 levels by storing it in the structure of a building. As the plants grow they process CO2 from the air, releasing oxygen back to the atmosphere and storing the carbon in their molecular structure. In this way a kg of strawbale sequesters 1.35 kgCO2 [18], and a kg of hemp sequesters 0.56 kgCO2 [17].
Potentially, a lot of CO2 can be locked up in this way (27.7 kg of CO2 per each 20.5 kg strawbale), and it is often stated as an extra environmental benefit of building with straw and hemp (I’m guilty here). The difficulty is that the stored carbon could be released at the end of a buildings life if the straw or hemp are allowed to rot, or burned. In this case their embodied carbon values (as above) remain the same, but the storage value is lost. For the storage to be significant long term, the materials would need to be reused.
Endnote
Hopefully I've made some sense of how I got my figures. There are holes in the data, but I think it's enough to provide some useful comparison of the contrasting carbon emissions from production of a few different wall-types. When there are different means to produce a building with the same operational energy efficiency and operational emissions, choosing the means with the lowest embodied carbon will always result in the lowest overall carbon emissions.
References
[1] C. Thormark, The effect of material choice on the total energy need and recycling potential of a building, Build. Environ. 41 (2006) 1019–1026. doi:10.1016/j.buildenv.2005.04.026.[2] M.J. González, J. García Navarro, Assessment of the decrease of CO2 emissions in the construction field through the selection of materials: Practical case study of three houses of low environmental impact, Build. Environ. 41 (2006) 902–909. doi:10.1016/j.buildenv.2005.04.006.[3] M.K. Dixit, J.L. Fernández-Solís, S. Lavy, C.H. Culp, Identification of parameters for embodied energy measurement: A literature review, Energy Build. 42 (2010) 1238–1247. doi:10.1016/j.enbuild.2010.02.016.[4] C.I. Jones, G.P. Hammond, Embodied energy and carbon in construction materials, Proc. ICE - Energy. 161 (2008) 87–98. doi:10.1680/ener.2008.161.2.87.[5] J. Monahan, J.C. Powell, An embodied carbon and energy analysis of modern methods of construction in housing: A case study using a lifecycle assessment framework, Energy Build. 43 (2011) 179–188. doi:10.1016/j.enbuild.2010.09.005.[6] L.F. Cabeza, C. Barreneche, L. Miró, J.M. Morera, E. Bartolí, A. Inés Fernández, Low carbon and low embodied energy materials in buildings: A review, Renew. Sustain. Energy Rev. 23 (2013) 536–542. doi:10.1016/j.rser.2013.03.017.[7] L.K. Gohar, K.P. Shine, Equivalent CO2 and its use in understanding the climate effects of increased greenhouse gas concentrations, Weather. 62 (2007) 307–311. doi:10.1002/wea.103.[8] G. Hammond, C. Jones, Inventory of Carbon and Energy (ICE), (2011). http://www.circularecology.com/embodied-energy-and-carbon-footprint-database.html (accessed November 28, 2014).[9] Wimmer, R., Hohensinner, H., Janisch, L., Heat Insulation Performance of Straw Bales and Straw Bale Walls, (2000). http://naturalbuildingcoalition.ca/Resources/Documents/Technical/heat_insulation_performance_strawbales.pdf (accessed November 21, 2014).[10] S. Goodhew, R. Griffiths, Sustainable earth walls to meet the building regulations, Energy Build. 37 (2005) 451–459. doi:10.1016/j.enbuild.2004.08.005.[11] B. Jones, Building with straw bales: a practical guide for the UK and Ireland, Green Books, Totnes, 2009.[12] MBC Timber Frame, Passive-Wall-Foundation-Junction.jpg (JPEG Image, 740 × 600 pixels) - Scaled (99%), 2015. http://www.mbctimberframe.co.uk/wp-content/uploads/2014/10/Passive-Wall-Foundation-Junction.jpg (accessed September 9, 2015).[13] ISOCELL gmbh, Environmental Product Declaration: ISOCELL cellulose fiber insulation, (2014). http://www.bau-epd.at/wp-content/uploads/2014/11/EPD-_ISOCELL_Ecoinvent_20140825-English.pdf (accessed September 8, 2015).[14] Termex, Environmental product declaration: Termex- cellulose fiber, (2014). http://www.termex.fi/files/Termex%20environmental%20declaration%202014.pdf (accessed September 8, 2015).[15] R. Walker, S. Pavia, R. Mitchell, Mechanical properties and durability of hemp-lime concretes, Constr. Build. Mater. 61 (2014) 340–348. doi:10.1016/j.conbuildmat.2014.02.065.[16] Limecrete Company Ltd., Hempcrete Factsheet - Essential hempcrete info, Limecrete Co. (2014). http://limecrete.co.uk/hempcrete-factsheet/ (accessed December 2, 2014).[17] K. Ip, A. Miller, Life cycle greenhouse gas emissions of hemp–lime wall constructions in the UK, Resour. Conserv. Recycl. 69 (2012) 1–9. doi:10.1016/j.resconrec.2012.09.001.[18] B. Sodagar, D. Rai, B. Jones, J. Wihan, R. Fieldson, The carbon-reduction potential of straw-bale housing, Build. Res. Inf. 39 (2011) 51–65. doi:10.1080/09613218.2010.528187.
