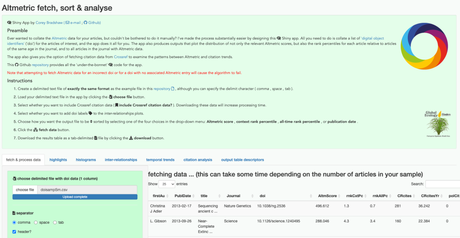
Last week I reported that I had finally delved into the world of R Shiny to create an app that calculates relative citation-based ranks for researchers.
I’m almost slightly embarrassed to say that Shiny was so addictive that I ended up making another app.
This new app takes any list of user-supplied digital object identifiers (doi) and fetches their Altmetric data for you.
Why might you be interested in a paper’s Altmetric data? Citations are only one measure of an article’s impact on the research community, whereas Altmetrics tend to indicate the penetration of the article’s findings to a much broader audience.
Altmetric is probably the leading way to gauge the ‘impact’ (attention) an article has commanded across all online sources, including news articles, tweets, Facebook entries, blogs, Wikipedia mentions and others.
And for those of us interested in influencing policy with our work, Altmetrics also collate citations arising from policy documents.
While Altmetric supplies some lovely badge widgets that you’ve mostly likely seen around various websites (including most publishers’ online portals), it is a bit unwieldy if you want to collate the data for a large number of articles, and then do any sort of analysis on them.
Then I discovered the R package rAltmetric, and my world changed. But to use rAltmetric, you have to be fairly proficient already in using R, which many people aren’t. Sooooooo …, I developed the app!
The new app — AltmetricShiny — accepts a text-file list of dois, and then does some under-the-bonnet calculations and displays to help you interpret their meanings.

While I clearly haven’t provided all the data collected by Altmetric, the app provides the following:
- a list of the articles derived from the doi text, including first author, date of publication, start of the title;
- the main Altmetric attention score (the default setting lists the articles with the highest attention score first);
- the ‘in-context’ rank percentile by age, which is the percentile of the Altmetric rank relative to all articles in the journal of the same age (lower percentiles mean higher ranks); and
- the all-time ‘in-context’ rank percentile, which is the percentile of the Altmetric rank relative to all articles in the journal.
Users also has the option of selecting whether they want Crossref citation data to be downloaded for each article, in which case the output file includes the number of citations and the citation rate (citations/year) for each article.

Finally, and perhaps of most interest to many in the conservation field, the app provides the number and times each article is cited in a policy document. This is perhaps one of the best reflections of ‘impact’ one can obtain with relative ease.

I’ve also coded the app to provide some basic summaries, plots and analyses, including:
- a ‘highlight’s page that gives the top-ranked article from the list, the range and inter-quartile range for the attention score, the median rank percentiles, the total number of articles cited in policy documents, and the total number of policy-document citations in the submitted sample;
- histograms of the three main metrics (attention score, age-based rank percentile, all-time rank percentile);
- the median values of the above metrics;
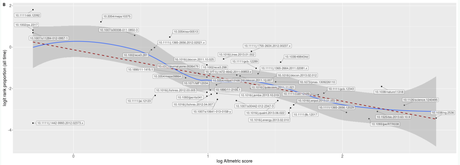
- the inter-relationships between the three metrics (with an option to label to the points on the graph with their respective doi);
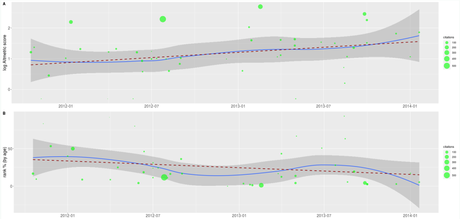
- temporal trend bubble-plots of each metric over time, with bubble size indicating total citations;
- a temporal trend bubble plot of the policy citations; and
- (if selected) plots of each metric relative to their citation rate as provided by Crossref.

For the inter-relationships and citation analysis, I also provide the information-theoretic evidence ratio between the intercept-only and linear slope models as evidence for a linear relationship (along with the corresponding R2). And for inter-relationships and temporal-trend plots, I also provide a loess fit to identify any non-linear behavior.

A few things to note when using the app:
- long lists of dois will slow down the processing time;
- adding citation data will slow down processing time even further;
- doi typos will cause the app to crash; and
- dois with no associated Altmetric data will cause the app to crash.
All the related R code is available here.
Enjoy!

