Last week I was lucky enough to attend the Second Workshop on Coupling Technologies for Earth System Models, held at the National Center for Atmospheric Research (NCAR) in Boulder, Colorado, USA. I was excited just to visit NCAR, which is one of the top climate research facilities in the world. Not only is it packed full of interesting scientists and great museum displays, but it’s nestled in the Rocky Mountains and so the view from the conference room looks like this:

Many of the visitors would spend large portions of the coffee breaks just staring out the window…
The conference was focused on couplers – the part of a climate model that ties all the other components (atmosphere, ocean, land, etc.) together. However, the presentations covered (as Rob Jacob put it) “everything that physical scientists don’t care about unless it stops working”. Since I consider myself a physical scientist, this included a lot of concepts I hadn’t thought about before:
- Parallel processing: Since climate models are so big, it makes sense to multitask by splitting the work over many computer processors. You have to allocate the right number of processors to each component, though: if the atmosphere has too many processors, it will finish its timestep too quickly and sit there waiting until the ocean is done, and vice versa. This is called load balancing, and it gets very tricky as soon as the number of components exceeds two.
- Scalability: The more processors you use, the faster the model runs, but the speed has diminishing returns. If you double the number of processors, you won’t quite double the speed, particularly if the number of processors exceeds 104 (a setup which is becoming increasingly affordable for large research groups). Historically, the coupler has not been a code bottleneck (limiting factor for model speed), but as the number of processors gets very large, that scenario is changing. We have to figure out the most efficient way to couple many small components together, so that climate model speed can continue to keep up with advances in computer hardware.
- Standardization: Modelling groups across the world are communicating with each other more and more, and using each other’s code. Currently this requires a lot of modifications, because every climate model has a different structure. Everyone seems to agree that it would be great to have a standard interface that allowed you to plug any combination of components together, but of course everyone has a different idea of what that standard should be.
- Fortran is still the best language for climate models, believe it or not, because it is the fastest language for the kinds of operations required. If a modern, accessible language like Python could compete based on speed, you can bet that new climate models like MPAS would use it.
I was at the conference with Steve Easterbrook and his new M.Sc. student Daniel Levy, presenting our bubble diagrams of model architecture. (If you haven’t already, read my AGU poster schpiel first, or none of this will make sense!) As interesting and useful as these diagrams are, there were some flaws in our original analysis:
- We didn’t use preprocessed code, meaning that each “model” is actually the code base for many different model configurations. So our estimate of model complexity based on line count is biased towards models which are very configurable, but might not actually be very complex. We can fix this by choosing specific configurations of each model (for consistency, the configuration used in CMIP5 or the equivalent EMIC AR5 intercomparison project) and obtaining preprocessed code from the corresponding institutions.
- We sorted the code into components (eg atmosphere) and sub-components (eg atmospheric aerosols) based on folder structure, which might not reflect the hierarchy of routines formed at runtime. Some modelling groups keep their files very organized, but often code from different parts of the model was mixed together, and separating it out was very much a judgment call. To fix this, we can sort based on the dependency structure (a massive tree graph showing which routines call which): all the descendants of the atmosphere driver are part of the atmosphere component, and so on.
- We made our diagrams in Microsoft PowerPoint, which is quite limited, and didn’t allow us to size the bubbles so their area was perfectly proportional to line count. Instead, we just had to eyeball it. We can fix this by using Adobe Illustrator, which is much more advanced and has this capability.
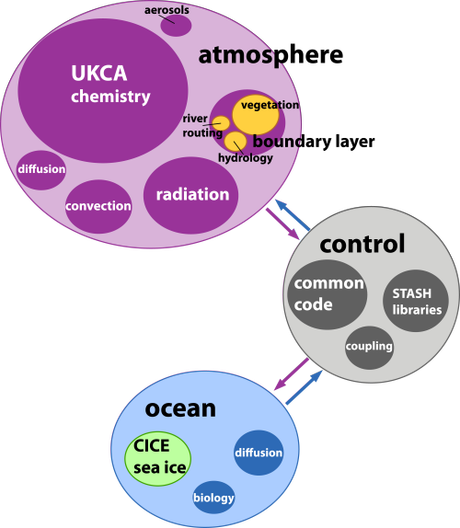
So far, we’ve repeated the analysis for the UK Met Office Model, version HadGEM2-ES. I created the dependency structure by going manually through every file and making good use of grep, which took hours and hours (although it was a nice, menial way to avoid studying for my courses!). Daniel is going to write a Fortran parser to make the job easier next time around. In the meantime, our HadGEM2-ES diagram is absolutely gorgeous and wonderfully accurate:

I will post future diagrams as they become available. We think the main use of these diagrams will be as communication tools between scientists, so they are free to use with attribution.
Just a few more weeks of classes, then I can enjoy some full-time research. Now that I’ve had a taste of being a proper scientist, it’s hard to go back!
