BOUCHER SCOUTING already provides exclusive player tracking data to the USHL's Tri-City Storm. It's never too late to get your team the data your competitors simply don't have!
What is defenseman A's success-rate when attempting a pass from the defensive-zone?
I TRACK THIS; AND MORE!
At what rate does player B give the puck-away in the offensive, defensive, or neutral-zone?
I TRACK THIS; AND MORE!
Boucher Scouting is an attempt to quantify players' performances. Boucher Scouting uses a player tracking system conceived, created and published by Christopher Boucher. It uses video to track every puck-possession event that occurs during a game. Here, we attempt to go beyond the arbitrary, and move toward tangible and reliable scouting reports. The system allows us to establish numbers relating to everything from how many loose-pucks a player recovers, to what a player's passing or puck-battle success-rate is in a specific zone. We also segregate numbers by manpower situation (even-strength, powerplay, short-handed).
I track each and every play; using specific in game situations to grade players performances. I input the results into a database, allowing me to track players' successes and failures. Whether it's an incomplete or complete pass-attempt, a won or lost race to a loose puck, a won or lost puck-battle, etc.; each result is tracked for each specific player.
The results are also tracked by zone (offensive/defensive/neutral) and by situation (even-strength/powerplay/short-handed) and imputed into the database as such. This allows me to track how each player performs in each zone, and in each manpower situation.
DAILY PLAYER REPORTS CAN BE GIVEN TO COACHES AND MANAGEMENT JUST HOURS AFTER A GAME.
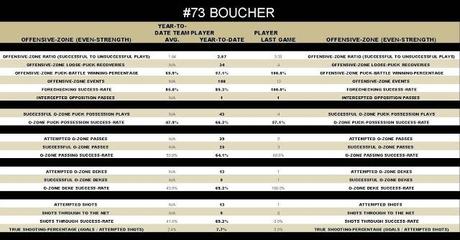
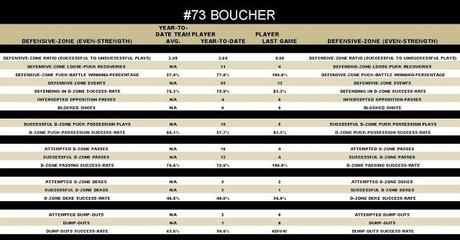
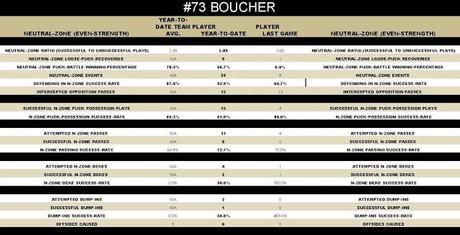
AN EXAMPLE OF A DAILY PLAYER REPORT AT EVEN-STRENGTH:


These reports can be communicated to players, or used simply as an evaluation tool. They can also be broken down into events per-minute played, and be tailored to each coach's need.
REFERENCE POINTS
These averages have been calculated over hundreds of games and approximately 2500 individual scouting reports.
Average grade: 67
Average ratio: 2.03
Average risk/reward: 1.31
Average offensive-zone risk/reward: 0.30
Average defensive-zone risk/reward: 0.62
Average neutral-zone risk/reward: 0.30
This system provides us with:
- Player tendencies in the offensive-zone
- Player tendencies in the defensive-zone
- Player tendencies in the neutral-zone
- Player tendencies while on the powerplay
- The ability to quantify players contributions while short-handed
- The ability to determine each player's true shooting percentage (goal/attempted shots)
- The ability to compare players using tangible results
CLICK HERE FOR DETAILED REPORTS CREATED FROM DATA ACQUIRED OVER THE COURSE OF AN ENTIRE MONTREAL CANADIENS SEASON -THIS IS HOW MUCH VALUABLE INFORMATION CAN BE ACCRUED FOR EACH PLAYER
CLICK HERE FOR BREAKDOWN OF SPECIFIC METRICS AND EVENTS THAT QUALIFY WITHIN EACH
CLICK HERE FOR AN EASY TO READ REPORT (INCLUDING GRAPHS) CREATED FOR A SPECIFIC GAME (INCLUDING SEASON AVERAGES)
Negative and positive impact on games
To further quantify a player's impact on games, We take a player's average playing time and divide it by the number of events. This allows us to determine not only how involved a player is in the game, but also how much of this involvement has a positive or negative effect on his team.
The resulting numbers indicate how many events a player is involved in during each minute of ice-time (events/min). They also indicate how many positive events a player contributes during a minute of ice-time (pos/min), and how many negative events a player contributes during a minute of ice-time (neg/min).
Ratio
We can determine a player's overall value to a club by tracking how many successful puck-possession plays a player makes for every 1 unsuccessful play; the resulting number is a player's ratio. This ratio can be broken down into zone or manpower situation (even-strength, short-handed, powerplay).
Risk-reward
We can also determine a player's overall value to a club by calculating the difference between positive events per minute of ice-time and negative events per minute of ice-time. We do this by subtracting the negative events per minute of ice-time from the positive events per minute of ice-time. The higher the resulting number the more value a player has to a team. We call the resulting number their, "risk / reward rating". Risk/reward is different from ratio because it also takes into account how involved a player is in the play. The more involved he is; the higher his risk/reward (as long as he's making successful plays).
CLICK HERE FOR AN EXAMPLE OF A RISK / REWARD REPORT
Risk-reward by zone
We further breakdown the risk / reward rating by zone. This allows us to quantify a players play into specific zones. Thereby rating a player's play in the offensive, defensive, and neutral zones.
CLICK HERE FOR AN EXAMPLE OF A RISK / REWARD REPORT FOR A SPECIFIC ZONE
