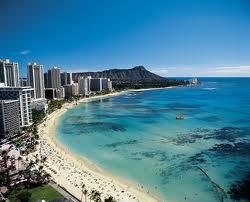
Dreaming of Honolulu during cold winter days
As I write this post, I'm experiencing yet another cold January day in Baltimore (click on the links of city names in this post for annual weather data). Every winter I get a little depressed because, well, like a lot of other people - I HATE the cold. I was in Orlando a couple of weeks ago (see my recent Disney World post) and the weather was lovely; very un-winter-like, with highs in the 70s and lows in the 50s and 60s. Places in the United States like Florida and Southern California have very mild (or practically no) winters. Put simply, they would seem to have more comfortable climates than most of the rest of the country, and certainly where I live in central Maryland. I hardly think that I need to explain the simple pleasure of good weather. Comfortable conditions (however they may be defined for a particular individual) improve mood and the enjoyment of nature and the outdoors. Long-term uncomfortable conditions or extreme weather makes you want to hide indoors. I doubt there are many people who would deny a preference for a pleasantly warm sunny day. Indoor climate control allows people to live in extreme locations (think Phoenix in summer or Fairbanks in winter), but deep winter cold and extreme summer heat can be dangerous or evenly deadly. You may prefer heat over cold or vice-versa, but how many enjoy the extremes over a moderate balance between the two?Thinking along these lines, I asked myself the question: can we identify the locations with the best year-round climates in the U.S.? I think we can, and I think I've developed a quantitative formula to do it. The rest of this post details a major research effort that I have undertaken to identify the cities with the best climate in the United States. I'm pleased with the results and think the formula can be applied to other regions of the globe.
How Can We Determine the "Best" Climate?
First, what weather conditions do we have to consider when determining the "best" climate? I would suggest the following five:
- temperature
- humidity
- precipitation
- sunshine
- wind
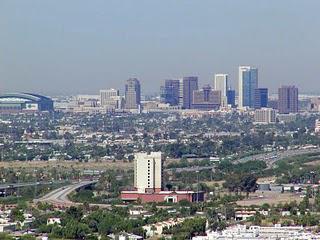
Phoenix under a scorching summer sun
Precipitation and sunshine can be considered together. Locations with plentiful sunshine can also see lots of rainfall (think Gulf of Mexico coastline). Some place with little rain, like Las Vegas, are sunbaked. Some places with heavy precipitation are often blanketed with clouds like the Olympic Peninsula of Washington. That said, precipitation is a good thing. Rain brings green landscapes, rivers, lakes, etc. All things that can be enjoyed. Also, places like central Florida see rain almost everyday during the summer, but it comes at predictable times and for short (and intense) durations. That type of rainfall is unlikely to ruin outdoor activities or cut down that much on daily sunshine. Overall, there are extremes, but precipitation and sunshine are not critical enough to affect our climate determinations. [Note: keep in mind that sunshine is not the same as daylight. All places in the U.S. (and world) get about the same amount of annual daylight, it's just distributed differently based on latitude. However, sunshine hours, i.e. non-overcast periods, vary by location.]
Wind can definitely affect comfort. A winter wind will make the wind chill drop below the actual temperature and can make being outdoors brutally uncomfortable. At the same time, a wind in summer can be cooling and welcomed. That being the case, in the U.S. average annual wind speeds vary very little between locations. No major cities experience average winds less than 5 mph and very few experience average winds more than 12 mph. See this wind speed table from the NOAA. Wind is important to comfort, but it doesn't vary enough between locations to be incorporated into my climate formula. Interestingly, the state with the highest average winds is Hawaii, situated in the famous Trade Winds.
That leaves temperature as the data to be used in my climate formula.
Conroy's Climate Formula
Before getting to the formula we need to go over the characteristics that should constitute an ideal climate:
1. Annual Mean Temperature. This is the baseline value for determining the best climate. The higher the average temperature the better. For instance, of all major cities in the U.S., the one with the highest annual mean temperature is Honolulu, Hawaii at 77.5 degrees. The lowest major city (I use the term loosely) is Fairbanks, Alaska at 28.0 degrees.
Now average temperature is important but in and of itself doesn't tell the whole story. For instance, Tulsa, Oklahoma and Santa Barbara, California both have an annual mean temperature of about 61 degrees, but they have drastically different climates. The January average in Santa Barbara is a comfortably cool 55 degrees, in Tulsa it is a cold 37 degrees. The August mean in Santa Barbara is a pleasant 69 degrees, the July mean in Tulsa is a hot 84 degrees. We must account for these different characteristics.
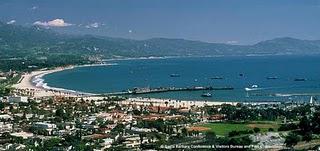
Beautiful Santa Barbara
2. Annual Temperature Variance. Stated simply, this is the difference between the mean temperature of the hottest and coldest months of the year. The lower the difference, the more consistent the climate. Consistency is good because it's less aggravating to people. In the U.S. the hottest month is usually July (east and south) or August (west) except for the notable exception of the upper San Francisco Bay Area where because of seasonal wind patters the hottest month is September. The coldest month is everywhere January.So for the above example, the annual temperature variance for Santa Barbara is a modest 14 degrees. For Tulsa it is an extreme 47 degrees. Few would argue that Santa Barbara has a better climate than Tulsa. However, the annual mean temperature and annual mean variance still only tell part of the story. We have to consider the daily comfort of a climate.

Baltimore, lovely in the summer
3. Monthly Mean Temperature. This considers what the temperature is actually like for each month of the year. If we pick my hometown, Baltimore, you will find significantly different conditions from say February to September. The February mean temperature is a cold 39 degrees, but the September mean temperature is an idyllic 73 degrees. To live in Baltimore in the winter is to be exposed to consistent cold air, in late summer to near perfect weather. That's a big difference and the quality of the climate in each month becomes crucial. As part of the formula provided below, "quality" points for the monthly mean temperature are applied. Here are the temperature ranges for the associated quality points:Monthly Mean Temperature Quality Points
- <0 degrees = -7 points
- 0-9 degrees = -6 points
- 10-19 degrees = -5 points
- 20-29 degrees = -4 points
- 30-39 degrees = -3 points
- 40-49 degrees = -2 points
- 50-54 degrees = -1 point
- 55-59 degrees = 0 points
- 60-64 degrees = 1 point
- 65-69 degrees = 2 points
- 70-74 degrees = 3 points
- 75-79 degrees = 2 points
- 80-84 degrees = 1 point
- 85-89 degrees = 0 point
- 90-95 degrees = -1 point
- >95 degrees = -3 points
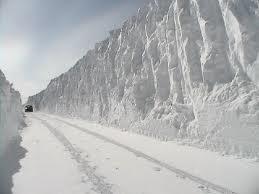
Fargo buried in snow!
A couple of important points to note from these ranges. I have assumed that the ideal mean temperature for comfort is in the low 70s, which would equate to something very much like September in Baltimore as described above. In this instance that would mean a mean high temperature of 81 degrees and a mean low temperature of 64 degrees. If you prefer cooler or warmer temperatures then the quality points could shift accordingly. What must be included here is the fewer (and negative) points for monthly mean temperatures that fall well below or above this ideal. An instance of extreme cold would be Fargo, North Dakota in January where the mean temperature is a brutal 7 degrees. An example of a very hot temperature would be Phoenix in July where the mean temperature is an oppressive 94 degrees. I skewed the point system towards warm temperatures because that's how I prefer them, but also because anecdotally it seems that hot is generally preferred over cold (though by no means is that preference universal).For each month quality points would be assessed and summed for a yearly total (see formula below).
4. Daily Temperature Variance. As with annual temperature variance, the daily or diurnal variance in temperature must be considered. Santa Fe, New Mexico has a very comfortable June mean of 66 degrees, but the mean June low is a cold 46 degrees and the high is a hot 83 degrees. That's nearly a 40 degree diurnal temperature change, which is not very comfortable. Think of the practicalities of planning for a heavy coat in the morning and shorts in the afternoon. As with the annual temperature variance, the less the daily temperature varies the better. To give a counter-example to Santa Fe, the October mean in Key West, Florida is a balmy 81 degrees, but the mean low is just 76 and the mean high just 85, a very small 9 degree diurnal change. No need to worry about different outfits in Key West.
Like monthly mean temperature, quality points are added to the daily temperature variance; the daily temperature variance ranges for the associated quality points:
Daily Temperature Variance Quality Points
- 0-10 degrees = 2 points
- 11-20 degrees = 1 point
- 21-30 degrees = 0 points
- 31-40 degrees = -1 points
- >40 degrees = -2 points
The Formula
My climate formula combines the four elements listed above in the following manner:
(1) annual mean temperature
(2) annual temperature variance
A. (1)/2 - (2)/2 = (3) [so annual mean temperature divided by 2 minus annual temperature variance divided by 2. The dividend is necessary to properly weight annual and monthly statistics, otherwise the annual statistics will dominate too much.]
(4) sum of the total quality points for monthly mean temperature and one-half the total quality points for monthly temperature variance [I consider monthly mean temperature twice as important as monthly temperature variance]
B. (3) + (4)/2 = (5) - final climate value [so I take value (3) above and add the total quality points from (4) divided by 2, again considering the annual temperature statistics twice as important as the monthly statistics.]

Chicago frozen in winter
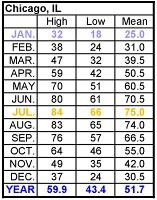
Looking at this another way, annual mean temperature is worth 1/3 of the score, annual temperature variance is worth 1/3 of the score, monthly mean temperature is worth 2/9 of the score, and monthly temperature variance is worth 1/9 of the score. I think these proportions yield logical results, but judge for yourself from the list below.Before we get to the list of the U.S. cities with best climates, lets apply the complete formula to two cities. I'll choose Chicago, Illinois and Houston, Texas. Note that all temperature data was taken from weather.com.
(1) annual mean temperature: Chicago- 51.7 degrees; Houston- 70.5 degrees
(2) annual temperature variance: Chicago- 50.0 degrees; Houston- 30.5 degrees
A. (1)/2 - (2)/2 = (3): Chicago- 0.8; Houston- 20.0
(4) quality points (monthly mean temperature / monthly temperature variance divided by 2):
Chicago- 1 (-5 / 6); Houston- 19 (13 / 6)
B. (3) + (4)/2 = (5): Chicago- 1.3; Houston; 29.5

Houston, green and warm
So Houston scores far higher than Chicago, meaning Houston has a far better climate. Note that the final climate values are relative only, they mean nothing in and of themselves. However, they do become meaningful once they are computed for a large number of cities. As a quick aside. I visited Houston for business in late April 2005. The weather was fabulous with highs around 80 and lows in the 60s. I visited Chicago for school in mid-May 1997. The weather was hit or miss with one nice day of highs around 70 contrasted by a cold day with highs only around 50. Such anecdotal experience provides some validation for the scores above. Now onto the list.---
Conroy's Climate Rankings (Major U.S. Cities, metro. pop. >100,000):
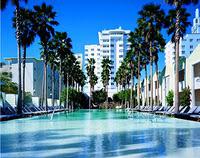
Beautiful and warm Miami
[Note that I will be creating a separate page on this blog and populating it with a lot of the background data that went into creating this ranking. I also intend to provide charts, graphs, and maps to further illustrate the information. I would, at some point in the future, create similar rankings for European, Asian, and other cities.]Click here to read Part 2
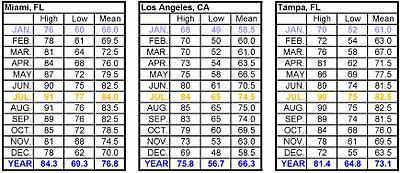
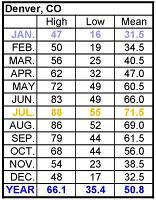
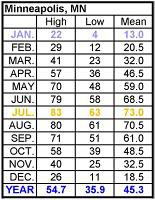
[Major cities (30 largest metro. areas) are bolded and annual and monthly values listed to provide additional context and comparison.]
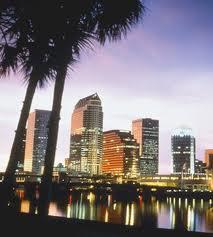
Tampa - Florida cities dominate the top of these rankings
1. Honolulu, HA - 48.3
2. MIAMI, FL - 44.9
3. Ft. Lauderdale, FL - 44.7
4. West Palm Beach, FL - 43.9
5. Naples, FL - 40.3
6. Ft. Myers, FL - 40.2
7. TAMPA, FL - 37.8
8. LOS ANGELES, CA - 37.1
9. Palm Bay, FL - 36.8
10. Sarasota, FL - 36.6
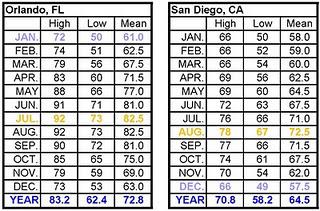
11. ORLANDO, FL - 36.4
12. SAN DIEGO, CA - 36.0
13. Lakeland, FL - 35.9
14. Brownsville, TX - 35.8
15. Daytona Beach, FL - 34.3
16. Corpus Christi, TX - 32.3
17. Ocala, FL - 32.1
18. Oxnard, CA - 31.9
19. McAllen, TX - 31.9
20. Oceanside, CA - 31.2
22. Santa Barbara, CA - 30.5
23. Gainesville, FL - 30.0
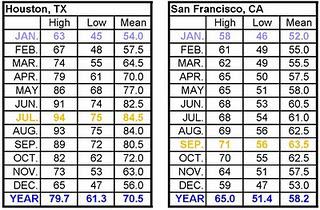
24. HOUSTON, TX - 29.5
25. Brunswick, GA - 29.0
26. New Orleans, LA - 28.9
27. Victoria, TX - 28.0
28. Oakland, CA - 28.0
29. SAN FRANCISCO, CA - 27.9
30. Beaumont, TX - 27.8
32. Pensacola, FL - 27.0
33. Lafayette, LA - 26.9
34. San Luis Obispo, CA - 26.8
35. San Jose, CA - 26.4
36. Laredo, TX - 26.2
37. Monterey, CA - 26.1
38. Lake Charles, LA - 25.5
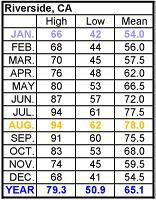
39. RIVERSIDE, CA - 25.3
40. Tallahassee, FL - 25.3
42. Panama City, FL - 24.3
43. Mobile, AL - 24.1
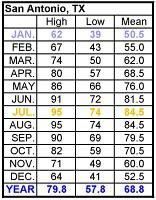
44. SAN ANTONIO, TX - 23.9
45. Baton Rouge, LA - 23.5
46. Yuma, AZ - 23.3
47. Valdosta, GA - 23.2
48. Austin, TX - 23.0
49. Palm Springs, CA - 22.7
50. College Station, TX - 22.7
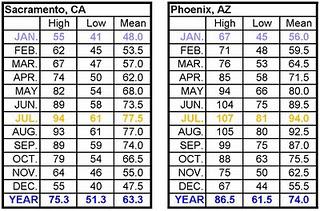
52. SACRAMENTO, CA - 22.4
53. Tucson, AZ - 22.0
54. Savannah, GA - 21.8
55. Fort Watson. FL - 21.5
56. Alexandria, LA - 21.5
57. PHOENIX, AZ - 21.0
58. El Centro, CA - 20.9
59. Modesto, CA - 20.9
60. Hattiesburg, MS - 20.6
61. Dothan, AL - 20.5
62. Tyler, TX - 20.3
63. Columbus, GA - 19.8
64. Albany, GA - 19.7
65. Stockton, CA - 19.5
66. Columbia, SC - 19.3
67. Visalia, CA - 19.3
68. Wilmington, NC - 19.2
69. Shreveport, LA - 18.8
70. Montgomery, AL - 18.3
72. Thomasville, AL - 18.2
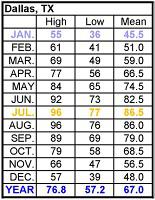
73. DALLAS, TX - 18.0
74. Myrtle Beach, SC - 17.9
75. Merced, CA - 17.6
76. Fresno, CA - 17.3
77. Texarkana, TX - 17.0
78. Macon, GA - 17.0
79. Jacksonville, NC - 16.8
80. Lake Havasu City, AZ - 16.7
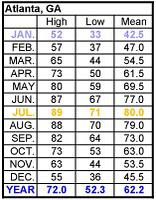
81. ATLANTA, GA - 16.6
82. Jackson, MS - 16.5
83. Augusta, GA - 16.3
84. Waco, TX - 16.0
85. El Paso, TX - 15.8
86. Chico, CA - 15.8
87. Virginia Beach, VA - 15.7
88. Monroe, LA - 15.6
89. Athens, GA - 15.5
90. San Angelo, TX - 15.4
91. Odessa, TX - 15.2
92. Greenville, NC - 14.9
93. Greenville, SC - 14.8
94. Charlotte, NC - 14.4
95. Tuscaloosa, AL - 14.2
96. Abilene, TX - 14.2
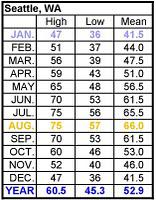
97. SEATTLE, WA - 14.2
98. Memphis, TN - 14.1
99. Birmingham, AL - 14.1
100. Fayetteville, NC - 14.0
102. Redding, CA - 13.8
103. Little Rock, AR - 13.8
104. Raleigh, NC - 13.5
105. Rocky Mount, NC - 13.4
106. Knoxville, TN - 13.3
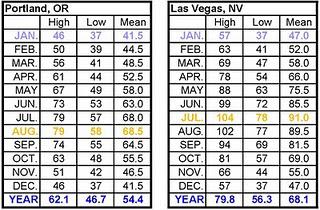
107. LAS VEGAS, NV - 13.0
108. Hickory, NC - 12.6
109. Chattanooga, TN - 12.0
110. Bellingham, WA - 12.0
111. Decatur, AL - 11.9
112. Winston-Salem, NC - 11.8
113. Jackson, TN - 11.8
114. Nashville, TN - 11.0
115. Salisbury, MD - 11.0
116. Salem, OR - 11.0
117. Las Cruces, NM - 10.6
118. Wichita Falls, TX - 10.6
119. Asheville, NC - 10.1
120. Fort Smith, AR - 10.1
122. Richmond, VA - 9.6
123. Lubbock, TX - 9.3
124. Eugene, OR - 9.3
125. Lawton, OK - 9.2
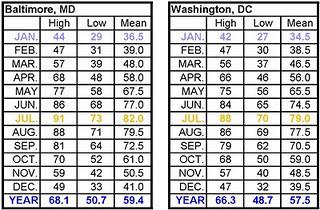
126. WASHINGTON, DC - 9.0
127. Atlantic City, NJ - 8.4
128. Danville, VA - 8.2
129. Dover, DE - 8.2
130. St. George, UT - 8.1
131. Louisville, KY - 8.0
132. Tulsa, OK - 7.9
133. Roanoke, VA - 7.7
134. Jonesboro, AR - 7.7
135. Fayeteville, AR - 7.5
136. Clarksville, TN - 7.4
137. Charlottesville, VA - 7.3
138. Amarillo, TX - 7.0
139. Medford, OR - 6.9
140. Oklahoma City, OK - 6.8
142. Lynchburg, VA - 6.7
143. Albuquerque, NM - 6.4
144. Charleston, WV - 6.3
145. Bowling Green, KY - 6.1
146. Prescott, AZ - 6.1
147. Lexington, KY - 6.1
148. Evansville, IN - 5.8
149. Joplin, MO - 5.8
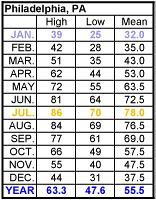
150. PHILADELPHIA, PA - 5.7
151. Kennewick, WA - 4.7
152. Morgantown, WV - 4.7
153. Harrisburg, PA - 4.5
154. Springfield, MO - 4.4
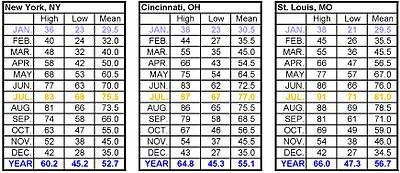
155. NEW YORK, NY - 4.3
156. Salt Lake City, UT - 4.1
157. Huntington, WV - 4.0
158. CINCINNATI, OH - 3.8
159. ST. LOUIS, MO - 3.6
160. Trenton, NJ - 3.4
162. Wheeling, WV - 3.2
163. York, PA - 3.0
164. Marietta, OH - 2.6
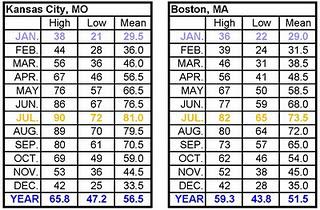
165. BOSTON, MA - 2.5
166. Akron, OH - 2.5
167. Lancaster, PA - 2.4
168. Hagerstown, MD - 2.3
169. Boise, ID - 2.2
170. Boulder, CO - 2.0
172. Columbus, OH - 1.9
173. Indianapolis, IN - 1.9
174. Dayton, OH - 1.8
175. Bloomington, IN - 1.8
176. Reno, NV - 1.6
177. Providence, RI - 1.6
178. CHICAGO, IL - 1.3
179. Wichita, KS - 1.1
180. Provo, UT - 1.1
181. Terre Haute, IN - 1.1
182. Columbia, MO - 0.5
183. Erie, PA - 0.3
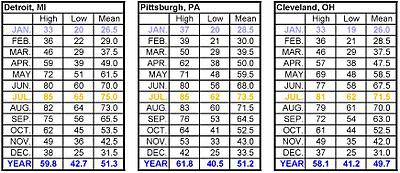
184. DETROIT, MI - 0.1
185. PITTSBURGH, PA - 0.1
186. Springfield, IL - -0.2
187. Farmington, NM - -0.2
188. CLEVELAND, OH - -0.2
189. Youngstown, OH - -0.2
190. Manhattan, KS - -0.3
192. Lafayette, IN - -0.5
193. Topeka, KS - -0.6
194. St. Joseph, MO - -0.8
195. Springfield, MA - -1.2
196. Allentown, PA - -1.2
197. Altoona, PA - -1.3
198. Scranton, PA - -1.4
199. Canton, OH - -1.5
200. Buffalo, NY - -1.8
201. Champaign, IL - -1.8
202. Coeur d'Alene, ID - -1.9
203. Bend, OR - -1.9
204. Pueblo, CO - -1.9
205. Williamsport, PA - -2.1
206. Norwich, CT - -2.3
207. Fort Collins, CO - -2.4
208. Davenport, IA - -2.5
209. Ogden, UT - -2.5
210. Santa Fe, NM - -2.8
211. Hartford, CT - -2.8
212. Kalamazoo, MI - -3.1
213. Rochester, NY - -3.2
214. Fort Wayne, IN - -3.3
215. South Bend, IN - -3.5
216. Grand Junction, CO - -3.6
217. Yakima, WA - -3.6
218. Bridgeport, CT - -3.6
219. Saginaw, MI - -3.7
220. Peroia, IL - -3.9
221. Poughkeepsie, NY - -3.9
222. Mansfield, OH - -3.9
223. Spokane,WA - -4.3
224. Iowa City, IA - -4.8
225. Elmira, NY - -5.3
226. Syracuse, NY - -5.3
227. Billings, MT - -5.4
228. Flagstaff, AZ - -5.4
229. Omaha, NE - -5.4
230. Colorado Springs, CO - -5.4
231. Des Moines, IA - -5.5
232. Utica, NY - -5.6
233. Grand Rapids, MI - -5.6
234. Lincoln, NE - -5.9
235. Binghamton, NY - -6.1
236. Milwaukee, WI - -6.4
237. Albany, NY - -6.5
238. Lansing, MI - -6.6
239. Missoula, MT - -6.8
240. Portland, ME - -7.1
241. Rockford, IL - -7.7
242. Cedar Rapids, IA - -7.8
243. Sioux City, IA - -8.1
244. Waterloo, IA - -9.4
245. Burlington, VT - -9.4
246. Rapid City, SD - -9.8
247. Idaho Falls, ID - -9.9
248. La Crosse, WI - -10.3
249. Bangor, ME - -10.9
250. Green Bay, WI - -11.8
252. Manchester, NH - -12.3
253. MINNEAPOLIS, MN - -12.6
254. Wausau, WI - -14.2
255. Sioux Falls, SD - -14.4
256. Eau Claire, WI - -15.0
257. Duluth, MN - -17.3
258. Anchorage, AK - -17.4
259. Bismarck, ND - -18.3
260. St. Cloud, MN - -18.9
261. Fargo, ND - -20.3
262. Fairbanks, AK - -38.8
Click here to read Part 2
Having trouble submitting comments, or are your comments not displayed after you submit them? If so, please email any comments or thoughts to [email protected].

