That said, shot attempts are the result of a change in playing style, and not indicative of the process involved in that change. Only through data-generated player tracking focusing on the events that impact possession can we work our way down to the process involved in score-effects; rather than just the result.
It's likely obvious to many who watched game 1 of the Stanley Cup finals that the Tampa Bay Lightning stopped trying to create offense, and focused on playing defense-first hockey early in the second period. The Lightning went from producing 24 shot-attempts in the first period, to 11 in the second, and 12 in the third.
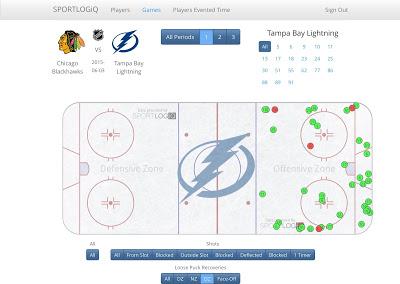
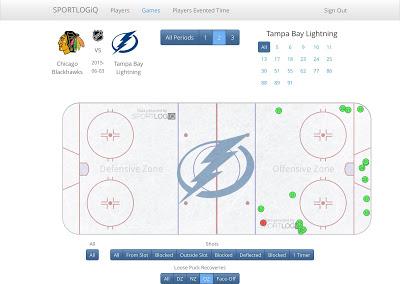
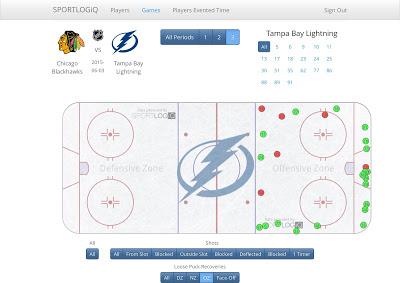
While scoring-chances generally come off the rush, shot-attempts are produced on the backs of the second-chances provided by offensive-zone loose-puck recoveries. The Lightning went from 37 offensive-zone loose-puck recoveries in the first period, to just 16 in the second and 20 in the third. It's also important to mention that 17 of those 20 third period LPR's came in the final 10 minutes of that third period.
FIRST PERIOD OFFENSIVE-ZONE LOOSE-PUCK RECOVERIES

SECOND PERIOD OFFENSIVE-ZONE LOOSE-PUCK RECOVERIES

THIRD PERIOD OFFENSIVE-ZONE LOOSE-PUCK RECOVERIES

Another metric that's indicative of a team's playing style is their play at both the defensive and offensive blueline. Teams that are protecting a lead with not only carry the puck into the offensive-zone less often, they will also carry the puck out of the defensive-zone less often. Coach's continually preach the importance of minimizing turnovers at either blueline, leading to any change in playing style focusing on increasing dump-ins and dump-outs, while limiting controlled exits and controlled entries.
In terms of controlled entries, Tampa Bay went from 15 controlled entries in the first period to just 7 in the second period and 10 in the third. Once again, it's important to mention that 7 of those 10 controlled entries occurred following the 10-minute mark of the third period.
The Lightning's defensive-blueline saw them go from 12 controlled exits in the first period to just 4 controlled exits in the second and 8 in the third; five after the 10-minute mark of the third. A decrease in controlled exits will generally result in an increase in dump-outs. This is the product of a team fearing a defensive-zone turnover. The lightning attempted to dump the puck out of their defensive-zone just 12 times in the first period, 18 times in the second period, and an incredible 28 times in the third.
How much a team forechecks can also indicate a change in playing style. Events used to determine forechecking success and frequency include blocked opposition passes in the offensive-zone, blueline holds, and stick/body-checks. Tampa attempted 19 stick or body checks in the offensive-zone during the first period of game 1, just 8 in the second, and 12 in the third. Not surprisingly, 10 of those third period forechecking plays occurred after Chicago's game-tying goal.
In terms of blocked opposition passes in the offensive-zone, the Lightning went from 6 in the first, 3 in the second and 8 in the third; with 5 of those coming after the Blackhawks tied the game up at 1. Tampa's defensemen were particularly active pressuring down the wall in the first period, as they attempted 9 blueline holds. That total dropped to just 2 in the second, and 9 in the third. Once again, 8 of those 9 third period blueline holds came after the game was tied, and 6 came after Chicago took the lead.
Another clue to intensity of a team's forechecking is found in the number of controlled exits produced by the opposition's defensemen. Team's who lay back in the neutral-zone allow opposition d-men to carry the puck freely out of the defensive-zone. In the first period Chicago Blackhawks defensemen had just 3 controlled exits, that total went to 4 in the second, before jumping to 7 in the third. A similar trend can be found in the number of neutral-zone passes by Hawks d-men as those totals also went from 3 in the first to 4 in the second and 7 in the third.
The number of loose-pucks in the neutral-zone recovered by the Lightning also dropped as the game progressed. Tampa was able to recover 69% of all neutral-zone loose-pucks in the first period, but only 44% in the second, and 35% in the third. The increase in Chicago's percentage is partly the result of the increase in the number of defensive-zone dump-outs produced by Lightning players during the second and third periods.
For the purpose of indicating score-effects, shot attempts are incredibly indicative of playing style. That said, they only allow us to view the result of a team's playing style, and are in no way able to breakdown the process involved in that style. Data-generated player tracking can not only produce the resulting data, it can shed light on the process, as well.
