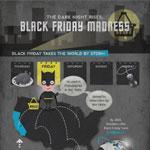
This Black Friday infographic from Sortable provides a brief history about Black Friday, some key stats on the globalization of this major shopping day, some of the top items people tend to buy, and finally a chart on the tremendous growth of Cyber Monday. Here are a couple of interesting facts about Black Friday:
- First started in Philadelphia in the 1960s
- 86 million people will shop on Black Friday
- 24% of shoppers will arrive at Midnight or before
- In shopper’s carts: 30% Toys, 40% Electronics, 51% Clothing
- $11.4 Billion spent by consumers on Black Friday in 2011

Infographic Source: Sortable


