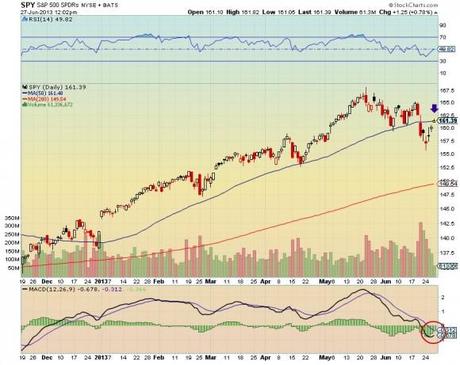
S&P 500 – $SPY chart technical analysis 2013.06.27
SPY testing resistance at its 50 days moving average. $SPY needs to clear resistance at $161.48 to go higher.

S&P 500 – $SPY chart technical analysis 2013.06.27
SPY testing resistance at its 50 days moving average. $SPY needs to clear resistance at $161.48 to go higher.