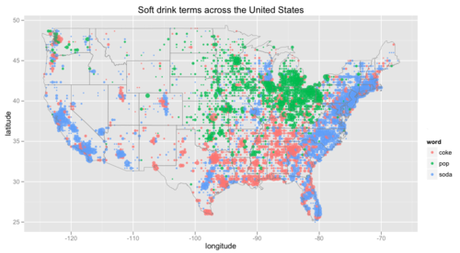
Twitter now has the power to unearth both raw numbers and insights into our language usage. The map above reveals regional language variations based on how we tweet about our beloved soft drinks. Edwin Chen, a data scientist at Twitter, used the site’s geo-tagging feature to search for tweets that contained the words, “coke,” “soda,” or “pop,” when users were talking about their drinks. Chen applied NLP technology into his analysis to ensure that the tweets were in fact soft drink related, and removed the tweets that were referring to the Coke brand. According to Chen’s blog, he then grouped the tweets that were within a 0.333 latitude/longitude radius, calculated the term distribution, and colored each group with the soft drink term that was furtherest away from the mean. Each point is sized according to the number of tweets in the group.
Chen’s results mirror those of other linguistic maps in the soda vs. pop debate, with a higher prevalence of the term “soda” in the Northeast and parts of the West Coast. The Midwest tends to use “pop,” and the South (and many spaces in between, including parts of the Pacific Northwest) prefers the word, “coke.” It is interesting to note that Chen’s results also have less occurrences of “pop” in the Northeast and less “coke” in the Southeast, compared to other maps on this subject.
While these linguistic differences might seem trivial, they are actually indicative of larger cultural differences in these areas. Chen’s findings also represent new possibilities of using Twitter to better understand how we speak. As people become more connected and are exposed to more regional dialects, this age-old divide will continue to evolve in parallel with our speech patterns.
