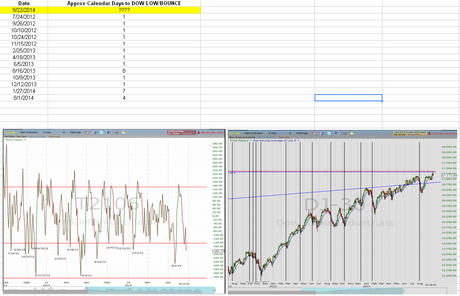
Here is the study:

Those lows have always come from just below the area of the 5 ema drawn of the lows on the 2 day Dow. Currently, that sits at DOW 17057 and rising. We do not have to hit that area, but the market always has in recent indicator cirscumstances.
So that would be the results of the study, i.e., that a bounce should be expected between here and a breach of the 5 ema (lows) on the DOW.
If this is a terminal wave the indicator study may not matter, but I am not assuming terminal wave absent a breakdown. The study is a rough study I put together this morning. I encourage you to do your own if you are interested in it.
******
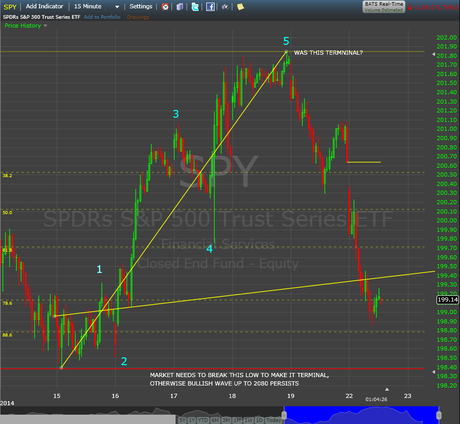
Here is the support on SPY. We had our five waves up. The question is whether that is terminal or not. ST bulls are safe buying this dip off the 88.6 Fibonacci Retrace so long as that pivot low holds. Chart:

******
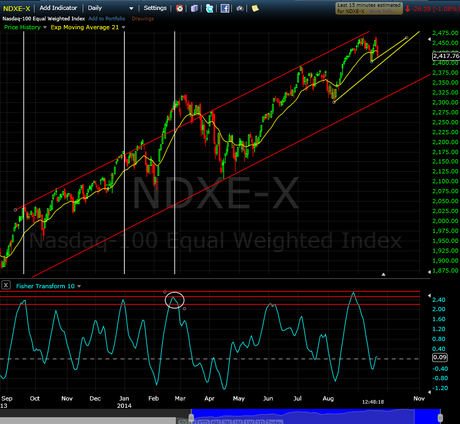
The market tested short term support this morning. As long as this area holds the short term bullish nature of the market still has a chance to run from here. Below this and the bearish weekly scenarios come into play.
Chart:

There is always a bull path and a bear path. We cannot know which path the future will choose. As always, do your own due diligence, read the disclaimer, and make your own investment decisions.
Peace, Om,
SoulJester