Courtesy of Scott Martindale, Senior Managing Director, Sabrient

The leading sectors on strong days were the leaders to the downside today: Materials, Energy, Financial, Technology, Industrial. All down about 2% or more. Volume was much greater in today’s weakness than we have seen since the March 16 selloff. The dollar was up +1.6% today while the overall market was down about the same amount. Clearly, stocks have benefited from a weak dollar, and today’s unusual strength in the greenback (due to a big increase in core CPI and unrest in Greece) was like a death knell for the bulls.
Each encouraging bounce is being met with selling – either late in the day or the following day. This is the behavior of hesitant bulls who are trying to anticipate a sustained reversal, but they can’t get traction without some leadership. The big cap Technology names are not providing it, and I’m sorry but the Healthcare sector is not an acceptable substitute.
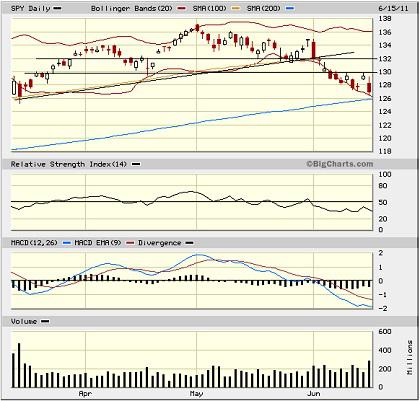
Tuesday was so promising, as stocks had their strongest day in almost two months. But today was an entirely different story. The market hit a new 3-month low, and the SPY has pulled back about 8% from its May high. It is also getting very close to testing important support at its 200-day moving average. A temporary breach wouldn’t be the end of the world – and a full 10% correction from the high actually might be healthy – but it would need to recover the 200-day quickly or risk having it become strong overhead resistance throughout the rest of the summer.

High volume today is less than the March 16 selloff, but still much higher than any other day since then. This might bode well for a washout of weak holders, which would enable the bulls to build a foundation. RSI and MACD are still severely oversold, which should lead to a more robust attempt to bounce, and price typically sets its sights on the upper Bollinger Band after sitting on the lower band for this long. The bands are quite spread apart, and due for a reversion. But Technology and Financials will have to firm up and become leaders again if the bulls are going to get something more significant than a brief bounce.
The TED spread (i.e., indicator of credit risk in the general economy, measuring the difference between the 3-month T-bill and 3-month LIBOR interest rates) closed at 19.92, which is down from last week and low in its normal range. Fear as measured by the CBOE market volatility index (VIX) closed at 21.32, which is up a good bit from last week, perhaps indicating a hint of increasing fear – or at least caution. This tends to back up the higher volume we saw in today’s selloff.
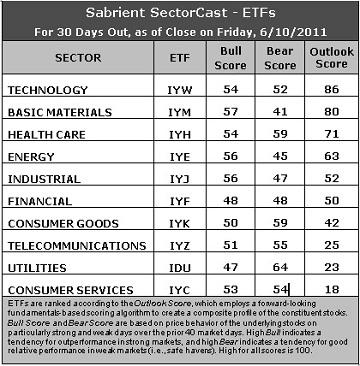
Latest rankings: The table ranks each of the ten U.S. industrial sector iShares (ETFs) by Sabrient’s proprietary Outlook Score, which employs a forward-looking, fundamentals-based, quantitative algorithm to create a bottom-up composite profile of the constituent stocks within the ETF. In addition, the table also shows Sabrient’s proprietary Bull Score and Bear Score for each ETF.
High Bull score indicates that stocks within the ETF have tended recently toward relative outperformance during particularly strong market periods, while a high Bear score indicates that stocks within the ETF have tended to hold up relatively well during particularly weak market periods. Bull and Bear are backward-looking indicators of recent sentiment trend.
As a group, these three scores can be quite helpful for positioning a portfolio for a given set of anticipated market conditions.

Not a lot of change in the relative sector rankings this week. Here are some notable observations in Sabrient’s SectorCast Outlook scores.
Technology (IYW) and Basic Materials (IYM) are holding the top two spots again. Analysts remain relatively quiet on supporting stocks lately. IYW has the best Outlook score of 86, while IYM comes in second with 80 (same as last week). Notably, IYW has fallen below its 200-day moving average while IYM is still clinging to it.
1. The selloff in Tech and Financial has reduced their projected P/Es, which is favorable on a forward-looking basis.
2. Healthcare (IYH) is back in the third spot ahead of Energy (IYE), but the difference is slight.
3. The 3-tier ranking, in which IYM led by a large margin, and IDU, IYC, and IYZ were mired at the bottom, has dissipated into a more smoothly distributed ranking. Nevertheless, the bottom three continue to be weighed down by poor support among analysts, high projected P/E, and in the case of IYC, poor return on sales as retail margins remain low.
4. The forward-looking Outlook rankings continue to reflect a cautiously bullish bent, which might be counterintuitive given what we see and hear in the news. The low score in Consumer Services (IYC) is the biggest fly in the ointment, but otherwise, the rise in IYW and ongoing strength in IWM and IYE (and even IYF) is moderately bullish.
Looking at the Bull scores, Industrial (IYJ), Energy (IYE), Technology (IYW), and Basic Materials (IYM), tend to lead on the strong market days. Financial (IYF) continues to be a big laggard on strong market days (along with Utilities, which is to be expected). Financial needs to get some footing and become a leader on bullish days if the market is going to get real traction.
As for the Bear scores, Utilities (IDU), Healthcare (IYH), and Consumer Goods (IYK) are the clear favorite “safe haven” sectors, as you would expect. Energy (IYE) and Basic Materials (IYM), which sport some of the best Bull scores, have been the clear laggards on weak market days, reflecting quick abandonment among investors.
Overall, Technology (IYW) now displays the best combination of Outlook/Bull/Bear scores. Adding up the three scores gives it a total score of 192. Healthcare (IYH) enjoys the best combination of Bull/Bear with a total score of 114.
Top ranked stocks in Technology and Basic Materials include LTX-Credence (LTXC), Novellus Systems (NVLS), Terra Nitrogen (TNH), and PolyOne (POL).
Low ranked stocks in Utilities and Consumer Services include Calpine (CPN), Clean Energy Fuels (CLNE), IHS Inc. (IHS), and amazon.com (AMZN).
These scores represent the view that the Technology and Basic Materials sectors may be relatively undervalued overall, while Utilities and Consumer Services sectors may be relatively overvalued, based on our 1-3 month forward look.
Disclosure: Author has no positions in stocks or ETFs mentioned.
About SectorCast: Rankings are based on Sabrient’s SectorCast model, which builds a composite profile of each equity ETF based on bottom-up scoring of the constituent stocks. The Outlook Score employs a fundamentals-based multi-factor approach considering forward valuation, earnings growth prospects, Wall Street analysts’ consensus revisions, accounting practices, and various return ratios. It has tested to be highly predictive for identifying the best (most undervalued) and worst (most overvalued) sectors, with a one-month forward look.
Bull Score and Bear Score are based on the price behavior of the underlying stocks on particularly strong and weak days during the prior 40 market days. They reflect investor sentiment toward the stocks (on a relative basis) as either aggressive plays or safe havens. So, a high Bull score indicates that stocks within the ETF have tended recently toward relative outperformance during particularly strong market periods, while a high Bear score indicates that stocks within the ETF have tended to hold up relatively well during particularly weak market periods.
Thus, ETFs with high Bull scores generally perform better when the market is hot, ETFs with high Bear scores generally perform better when the market is weak, and ETFs with high Outlook scores generally perform well over time in various market conditions.
Of course, each ETF has a unique set of constituent stocks, so the sectors represented will score differently depending upon which set of ETFs is used. For Sector Detector, I use ten iShares ETFs representing the major U.S. business sectors.
About Trading Strategies: There are various ways to trade these rankings. First, you might run a sector rotation strategy in which you buy long the top 2-4 ETFs from SectorCast-ETF, rebalancing either on a fixed schedule (e.g., monthly or quarterly) or when the rankings change significantly. Another alternative is to enhance a position in the SPDR Trust exchange-traded fund (SPY) depending upon your market bias. If you are bullish on the broad market, you can go long the SPY and enhance it with additional long positions in the top-ranked sector ETFs. Conversely, if you are bearish and short (or buy puts on) the SPY, you could also consider shorting the two lowest-ranked sector ETFs to enhance your short bias.
However, if you prefer not to bet on market direction, you could try a market-neutral, long/short trade—that is, go long (or buy call options on) the top-ranked ETFs and short (or buy put options on) the lowest-ranked ETFs. And here’s a more aggressive strategy to consider: You might trade some of the highest and lowest ranked stocks from within those top and bottom-ranked ETFs, such as the ones I identify above.

