I’ll keep this short since I’m traveling and it’s quite late on Wednesday night right now in Dallas. There isn’t much to talk about other than Europe. That’s all you see on CNBC. Maybe there’s an occasional mention of the latest earnings miss or some other dismissible news item. But the prognosis for the U.S. is quite positive, provided the euro-zone doesn’t send the global economy into a spiral. The reality of a truly global economy is upon us – and all eyes remain on Greece and Italy.
It might surprise you to know that Italy has one of the world’s largest bond markets. So, European banks hold a lot of Italian bonds, which are losing value by the day as buyers flee and yields soar to third-world levels. We have already seen how bad it can get with the situation in Greece. However, the European Central Bank (ECB) won’t pour money into buying Italian debt (like the Fed does to support U.S. Treasuries and keep interest payments low) until Italy passes the austerity package it promised earlier.
U.S. stock investors have been quite patient. It’s obvious that stocks are ready to rally, given a suitable plan to address Europe’s financial woes.
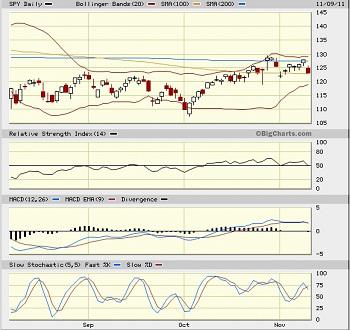
The SPY closed Wednesday at 123.16, which is right about where it was last Wednesday. The 200-day simple moving average again has imposed strong resistance, while the 100-day is providing support. The Bollinger Bands (two standard deviations above and below the 20-day moving average) have converged again, while RSI is back to neutral and MACD and Slow Stochastic appear to be rolling over.

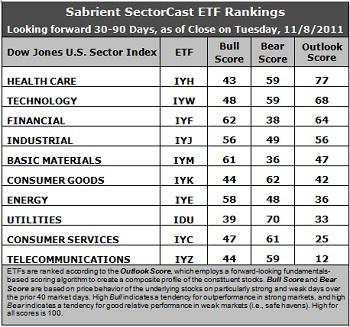
Latest rankings: The table ranks each of the ten U.S. industrial sector iShares (ETFs) by Sabrient’s proprietary Outlook Score, which employs a forward-looking, fundamentals-based, quantitative algorithm to create a bottom-up composite profile of the constituent stocks within the ETF. In addition, the table also shows Sabrient’s proprietary Bull Score and Bear Score for each ETF.
High Bull score indicates that stocks within the ETF have tended recently toward relative outperformance during particularly strong market periods, while a high Bear score indicates that stocks within the ETF have tended to hold up relatively well during particularly weak market periods. Bull and Bear are backward-looking indicators of recent sentiment trend.
As a group, these three scores can be quite helpful for positioning a portfolio for a given set of anticipated market conditions.
1. Healthcare (IYH) and Technology (IYW) iShares continue to hold the top two spots, with Outlook scores of 77 and 68, respectively. Both scores are slightly down from last week, reflecting some level of indecision in the analyst community.
2. Financial (IYF) is hanging in at number three, followed by Industrial (IYJ) and Basic Materials (IYM), which are both slightly stronger this week in the rankings. This is a bullish sign.
3. Consumer Services (IYC) and Telecom (IYZ) are back in the bottom two. Stocks within IYC and IYZ are saddled with high projected P/Es and low analyst support.
4. Overall, I would say that the Outlook rankings are still slightly bullish, although not by much. I say this because economically-sensitive iShares like IYW, IYF, IYJ, and IYM rank higher than IYK and IDU. Only consumer-oriented IYC continues to lack relative fundamental support.
5. Looking at the Bull scores, IYF has been the leader on strong market days, scoring 62, followed by IYM. IDU is by far the weakest with a 39.
6. As for the Bear scores, IDU is the clear investor favorite “safe haven” on weak market days with a score of 70. IYK is a distant second at 62. IYM carries by far the lowest Bear score of 36. It seems that no one wants to hold a Materials stock when the market sells off.
These scores represent the view that the Healthcare and Technology sectors may be relatively undervalued overall, while Consumer Services and Telecom sectors may be relatively overvalued, based on our 1-3 month forward look.Disclosure: Author has no positions in stocks or ETFs mentioned.
About SectorCast: Rankings are based on Sabrient’s SectorCast model, which builds a composite profile of each equity ETF based on bottom-up scoring of the constituent stocks. The Outlook Score employs a fundamentals-based multi-factor approach considering forward valuation, earnings growth prospects, Wall Street analysts’ consensus revisions, accounting practices, and various return ratios. It has tested to be highly predictive for identifying the best (most undervalued) and worst (most overvalued) sectors, with a one-month forward look.
Bull Score and Bear Score are based on the price behavior of the underlying stocks on particularly strong and weak days during the prior 40 market days. They reflect investor sentiment toward the stocks (on a relative basis) as either aggressive plays or safe havens. So, a high Bull score indicates that stocks within the ETF have tended recently toward relative outperformance during particularly strong market periods, while a high Bear score indicates that stocks within the ETF have tended to hold up relatively well during particularly weak market periods.
Thus, ETFs with high Bull scores generally perform better when the market is hot, ETFs with high Bear scores generally perform better when the market is weak, and ETFs with high Outlook scores generally perform well over time in various market conditions.
Of course, each ETF has a unique set of constituent stocks, so the sectors represented will score differently depending upon which set of ETFs is used. For Sector Detector, I use ten iShares ETFs representing the major U.S. business sectors.
About Trading Strategies: There are various ways to trade these rankings. First, you might run a sector rotation strategy in which you buy long the top 2-4 ETFs from SectorCast-ETF, rebalancing either on a fixed schedule (e.g., monthly or quarterly) or when the rankings change significantly. Another alternative is to enhance a position in the SPDR Trust exchange-traded fund (SPY) depending upon your market bias. If you are bullish on the broad market, you can go long the SPY and enhance it with additional long positions in the top-ranked sector ETFs. Conversely, if you are bearish and short (or buy puts on) the SPY, you could also consider shorting the two lowest-ranked sector ETFs to enhance your short bias.
However, if you prefer not to bet on market direction, you could try a market-neutral, long/short trade—that is, go long (or buy call options on) the top-ranked ETFs and short (or buy put options on) the lowest-ranked ETFs. And here’s a more aggressive strategy to consider: You might trade some of the highest and lowest ranked stocks from within those top and bottom-ranked ETFs, such as the ones I identify above.

