 Stocks are inching ever forward, but investors are showing plenty of indecisiveness along the way. They might be suffering from acrophobia—fear of heights. Their trepidation is reflected not only in the ongoing price consolidation as the major market averages struggle at long-term highs, but also in the extremely low trading volume. The Dow and S&P 500 are teetering at 5-year highs, the Nasdaq is at a 12-year high, and the Russell 2000 small caps and the Dow Jones Transportation Average are at all-time highs.
Perhaps investors are busy nursing nosebleeds from the thin air up here. Perhaps they are listening to all the warnings about an imminent correction. Perhaps they have been suffering anxiety about what President Obama might say—and did say—in his State of the Union address.
The President’s noble vision for the country is one in which a compassionate Federal government arrives like a superhero to right wrongs and alleviate all suffering. Such an ambitious objective is costly and therefore must be financed by taxing the productive elements of society, especially the rich who have obviously plundered and exploited the rest of us and so must be forced to pay their proverbial “fair share.”
But the true yardstick of a fair and compassionate nation should be how few people need government programs rather than how many are being served and how much assistance is doled out. And history has proven that entitlements foster dependency. It also has proven that the best way to help a struggling populace is not through make-work initiatives, government-directed training programs, mandated wage levels, and wealth redistribution, but by providing the freedom for people to do what comes naturally in a free society, i.e., pursue market-driven opportunities, innovate, take risks, hire staff in accordance with business growth, pay market-based wages and benefits, and expand wealth.
In other words, seek first and foremost to encourage the pie to grow rather than focus on how to slice up the current pie in ways that stifle its growth. Rather than arbitrarily deciding who should get less pie and who deserves more pie, let’s have more pie for everyone! And no, you can’t create enduring economic growth by simply printing money and handing it out through individual and corporate welfare programs.
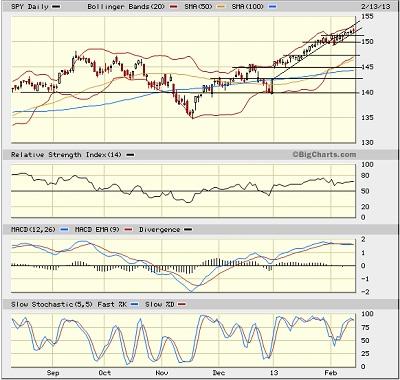
Let’s look at the charts. Among the ten U.S. industrial sector iShares ETFs, Industrial (IYJ) has been particularly strong lately. The S&P500 SPDR Trust (SPY) closed Wednesday at 152.15 as it attempts to break out of its technical consolidation since overcoming tough psychological resistance at 150. Certainly Dow 14,000 also has impacted investor psychology. The 50-day simple moving average continues to hold after crossing bullishly through the 100-day SMA. Oscillators RSI and MACD still have not cycled all the way back down from overbought territory since the year began, and Slow Stochastic is also back in overbought territory after making a brief trip to the neutral line.

After surpassing 150, SPY tested resistance-turned-support within a narrow sideways channel that appeared to be the makings of a bull flag continuation pattern, with the uptrend line of support starting from the bottom of the New Year’s gap serving as the flagpole. But the top of the sideways channel broke quickly, and now I see what appears to be a bullish rising channel, although not without the indecision reflected by Wednesday’s doji. If the bull flag breakout fails, I expect strong support at 150, the convergence of the 50-day SMA and prior resistance at 148, and then the top of the gap at 145.
The CBOE Market Volatility Index (VIX), a.k.a. “fear gauge,” closed Wednesday at 12.98, which is near its 52-week low. No investor fear in sight according to this indicator.
Overall, whether or not we see a temporary correction, equities remain well-positioned to attract investors. I fully expect the S&P 500 to ultimately challenge its all-time closing high of 1565.
By the way, I finally sold the last of my SPY Feb 144 call options at the close on Tuesday in advance of the President’s speech. Too much risk to hold into his speech, given expiration this week.
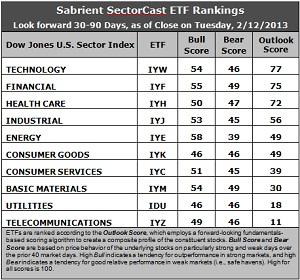
Latest rankings: The table ranks each of the ten U.S. industrial sector iShares ETFs by Sabrient’s proprietary Outlook Score, which employs a forward-looking, fundamentals-based, quantitative algorithm to create a bottom-up composite profile of the constituent stocks within the ETF. The multi-factor model considers forward valuation, historical earnings trends, earnings growth prospects, the dynamics of Wall Street analysts’ consensus estimates, accounting practices and earnings quality, and various return ratios. In addition, the table also shows Sabrient’s proprietary Bull Score and Bear Score for each ETF.
High Bull score indicates that stocks within the ETF have tended recently toward relative outperformance during particularly strong market periods, while a high Bear score indicates that stocks within the ETF have tended to hold up relatively well during particularly weak market periods. Bull and Bear are backward-looking indicators of recent sentiment trend.
As a group, these three scores can be quite helpful for positioning a portfolio for a given set of anticipated market conditions.

Observations:
1. Technology (IYW) stays in the top spot with a slightly lower score of 77, while Financial (IYF) moves back into second place with a score of 75 in its weekly battle with Healthcare (IYH). These three generally have been controlling the top of the sector rankings for a while now. IYW and IYF enjoy the lowest forward P/Es. Stocks within IYW also show strong projected growth and solid return ratios, while stocks within IYF have enjoyed the most support from Wall Street analysts in the form of earnings upgrades.
2. Telecom (IYZ) stays in the cellar with an Outlook score of 11, which is slightly improved as Wall Street has let up a bit on its reductions to earnings estimates within the sector. It is joined in the bottom two this week by Utilities (IDU) with a score of 18 as Wall Street suddenly came out with a rash of downgrades in the sector.
3. Overall, this week’s rankings appear to have moved the needle a little more bullish (after moving somewhat less bullish last week), as defensive sectors Consumer Goods (IYK) and Utilities (IDU) fell somewhat while economically-sensitive sectors Financial (IYF), Industrial (IYJ), and Materials (IYM) rose.
4. Looking at the Bull scores, Energy (IYE) is the leader on strong market days, scoring 58, while defensive sectors Consumer Goods (IYK) and Utilities (IDU) are the laggards on strong market days, scoring 46. This is only a 12-point range from top to bottom, which continues to indicate high correlation across sectors on those particularly strong market days. Energy stocks have tended to perform the best when the market is rallying, while Consumer Goods stocks have lagged.
5. Looking at the Bear scores, Financial (IYF) and Basic Materials (IYM) are serving as the favorite “safe havens” on weak market days, scoring 49, while Energy (IYE) is the worst during market weakness, as reflected in its low Bear score of 39. But there’s still only a 10-point range from top to bottom and none are scoring above 50, which indicates high correlation among sectors and across-the-board selling on particularly weak market days. Energy stocks, which are the leaders on strong market days, have been selling off the most when the market is pulling back, while Materials and Financial stocks have held up the best, relatively speaking.
6. Overall, Financial (IYF) shows the best all-weather combination of Outlook/Bull/Bear scores. Adding up the three scores gives a total of 179, followed by Technology (IYW) at 177. Telecom (IYZ) is by far the worst at 106. Looking at just the Bull/Bear combination, Financial (IYF) again has the best score at 104, followed by Materials (IYM) at 103. Consumer Goods (IYK) and Utilities (ID) share the lowest at 92. This indicates that Financial stocks have tended to perform the best in all market conditions.
These scores represent the view that the Technology and Financial sectors may be relatively undervalued overall, while Telecom and Utilities sectors may be relatively overvalued based on our 1-3 month forward look.
Top-ranked stocks within IYW and IYF include CommVault Systems (CVLT), 3D Systems (DDD), Jones Lang LaSalle (JLL), and Portfolio Recovery Associates (PRAA).
Disclosure: Author has no positions in stocks or ETFs mentioned.
About SectorCast: Rankings are based on Sabrient’s SectorCast model, which builds a composite profile of each equity ETF based on bottom-up aggregate scoring of the constituent stocks. The Outlook Score employs a fundamentals-based multi-factor approach considering forward valuation, earnings growth prospects, Wall Street analysts’ consensus revisions, accounting practices, and various return ratios. It has tested to be highly predictive for identifying the best (most undervalued) and worst (most overvalued) sectors, with a 1-3 month forward look.
Bull Score and Bear Score are based on the price behavior of the underlying stocks on particularly strong and weak days during the prior 40 market days. They reflect investor sentiment toward the stocks (on a relative basis) as either aggressive plays or safe havens. So, a high Bull score indicates that stocks within the ETF have tended recently toward relative outperformance during particularly strong market periods, while a high Bear score indicates that stocks within the ETF have tended to hold up relatively well during particularly weak market periods.
Thus, ETFs with high Bull scores generally perform better when the market is hot, ETFs with high Bear scores generally perform better when the market is weak, and ETFs with high Outlook scores generally perform well over time in various market conditions.
Of course, each ETF has a unique set of constituent stocks, so the sectors represented will score differently depending upon which set of ETFs is used. For Sector Detector, I use ten iShares ETFs representing the major U.S. business sectors.
About Trading Strategies: There are various ways to trade these rankings. First, you might run a sector rotation strategy in which you buy long the top 2-4 ETFs from SectorCast-ETF, rebalancing either on a fixed schedule (e.g., monthly or quarterly) or when the rankings change significantly. Another alternative is to enhance a position in the SPDR Trust exchange-traded fund (SPY) depending upon your market bias. If you are bullish on the broad market, you can go long the SPY and enhance it with additional long positions in the top-ranked sector ETFs. Conversely, if you are bearish and short (or buy puts on) the SPY, you could also consider shorting the two lowest-ranked sector ETFs to enhance your short bias.
However, if you prefer not to bet on market direction, you could try a market-neutral, long/short trade—that is, go long (or buy call options on) the top-ranked ETFs and short (or buy put options on) the lowest-ranked ETFs. And here’s a more aggressive strategy to consider: You might trade some of the highest and lowest ranked stocks from within those top and bottom-ranked ETFs.

