 Another earnings season is underway. I haven’t noticed much in the way of earnings pre-announcements (i.e., warnings), which is a positive sign. However, the big banks continue to consolidate and “rationalize” their cost structure in the wake of the post-2008 crisis and the resulting new regulations, with Morgan Stanley on Wednesday announcing layoffs of some 6% of their workforce, primarily in sales, trading, and investment banking roles, plus some IT support. But this is mostly impacting the big banks alone, while much of the rest of the Financial sector looks strong and poised to lead the markets this year. Overall, the markets sure look positive.
Despite the brief stock rally in the wake of the fiscal cliff “resolution,” investors are now wary of the intractable problems that remain—particularly the looming debt ceiling and runaway spending. But the bulls are pushing ahead, consolidating their recent gains, and appear to be plotting an attack on the 2012 highs.
On that bullish note, Sabrient “Baker’s Dozen” Top Stocks list for 2013 will be released on January 11 in conjunction with a Unit Investment Trust for the same 13 high-potential (and reasonably-priced) stocks. Last year’s model portfolio gained an astounding +43%. You can learn more at http://www.sabrientsystems.com/bakers-dozen-2013
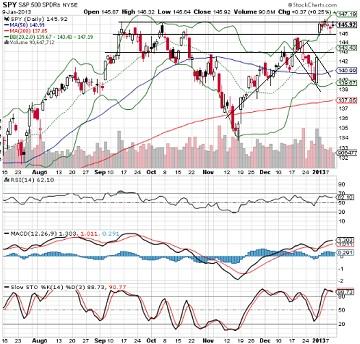
The S&P 500 SPDR Trust (SPY) closed Wednesday at 145.92, which is just about where it was last Wednesday—consolidating gains and reloading in an attempt to break through triple-top resistance in the 146-148 range. You can see on the chart that price is still consolidating last week’s massive gap breakout, which blasted through resistance at 143 and 145. It now is trying to break through this area of triple-top resistance (146-148). Oscillators RSI, MACD, and Slow Stochastic are all quite overbought (although MACD shows a bullish crossover), so perhaps a partial retracement of the breakaway gap is in the works before the next breakout.

The CBOE Market Volatility Index (VIX), a.k.a. “fear gauge,” closed Wednesday at 13.81, which is well below the important 20 threshold, but also right at strong support around 14. The mixed message here is that fear is low, which is bullish for stocks, but a bounce from support might send stocks lower, at least temporarily.
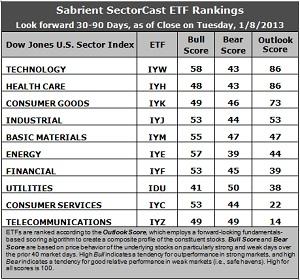
Latest rankings: The table ranks each of the ten U.S. industrial sector iShares (ETFs) by Sabrient’s proprietary Outlook Score, which employs a forward-looking, fundamentals-based, quantitative algorithm to create a bottom-up composite profile of the constituent stocks within the ETF. In addition, the table also shows Sabrient’s proprietary Bull Score and Bear Score for each ETF.
High Bull score indicates that stocks within the ETF have tended recently toward relative outperformance during particularly strong market periods, while a high Bear score indicates that stocks within the ETF have tended to hold up relatively well during particularly weak market periods. Bull and Bear are backward-looking indicators of recent sentiment trend.
As a group, these three scores can be quite helpful for positioning a portfolio for a given set of anticipated market conditions.

Observations:
1. Technology (IYW) has surged back to the top and into a tie with Healthcare (IYH), each with an Outlook score of 86. IYH shows relatively good support among analysts, a reasonably good forward P/E, and solid return ratios, while Technology (IYW) shows strong projected growth and a low forward P/E, as well as impressive return ratios. Consumer Goods (IYK) comes in third this week at 73, and then there’s a 20-point gap down to fourth place Industrial (IYJ).
2. Telecom (IYZ) stays in the cellar with an Outlook score of 14, and is again joined in the bottom two this week by Consumer Services (IYC) with a 22. Stocks within IYZ appear overvalued from the standpoint of the forward P/E and lack analyst support.
3. This week’s rankings are decidedly less defensive, given the rise in Tech, Industrial, and Basic Materials (IYM) at the expense of Consumer Goods. Overall, I would characterize the fundamentals-based Outlook rankings as neutral, but with a bullish trend in place compared with recent rankings.
4. Looking at the Bull scores, Technology (IYW) has surged into the lead as the clear leader on strong market days, scoring 58. Utilities (IDU) is the laggard on strong market days, scoring 41. In other words, Tech stocks have tended to perform the best when the market is rallying, while Utilities stocks have lagged.
5. Looking at the Bear scores, none of the sectors are scoring very high. Utilities (IDU) is still the favorite safe haven on weak market days, but it’s only scoring an anemic 50, which indicates that most everything is selling off during recent market weakness. Energy (IYE) is the worst during market weakness, as reflected in its low Bear score of 39, but there’s only an 11-point range from top to bottom. Still, Energy stocks have been selling off the most when the market is pulling back, while Utilities stocks have held up the best.
6. Overall, Technology (IYW) now shows the best all-weather combination of Outlook/Bull/Bear scores. Adding up the three scores gives a total of 187. Telecom (IYZ) is by far the worst at 112. Looking at just the Bull/Bear combination, Healthcare (IYH), although tied for first in Outlook score, doesn’t look very good at all—with a total score of only 91—which is tied with Utilities (IDU) for the lowest. Basic Materials (IYM) has the best score at 102.
These scores represent the view that the Technology and Healthcare sectors may be relatively undervalued overall, while Telecom and Consumer Services sectors may be relatively overvalued based on our 1-3 month forward look.
Top-ranked stocks within IYW and IYH include Google (GOOG), Rackspace Hosting (RAX), Intuitive Surgical (ISRG), and Regeneron Pharmaceuticals (REGN).
Disclosure: Author has no positions in stocks or ETFs mentioned.
About SectorCast: Rankings are based on Sabrient’s SectorCast model, which builds a composite profile of each equity ETF based on bottom-up aggregate scoring of the constituent stocks. The Outlook Score employs a fundamentals-based multi-factor approach considering forward valuation, earnings growth prospects, Wall Street analysts’ consensus revisions, accounting practices, and various return ratios. It has tested to be highly predictive for identifying the best (most undervalued) and worst (most overvalued) sectors, with a 1-3 month forward look.
Bull Score and Bear Score are based on the price behavior of the underlying stocks on particularly strong and weak days during the prior 40 market days. They reflect investor sentiment toward the stocks (on a relative basis) as either aggressive plays or safe havens. So, a high Bull score indicates that stocks within the ETF have tended recently toward relative outperformance during particularly strong market periods, while a high Bear score indicates that stocks within the ETF have tended to hold up relatively well during particularly weak market periods.
Thus, ETFs with high Bull scores generally perform better when the market is hot, ETFs with high Bear scores generally perform better when the market is weak, and ETFs with high Outlook scores generally perform well over time in various market conditions.
Of course, each ETF has a unique set of constituent stocks, so the sectors represented will score differently depending upon which set of ETFs is used. For Sector Detector, I use ten iShares ETFs representing the major U.S. business sectors.
About Trading Strategies: There are various ways to trade these rankings. First, you might run a sector rotation strategy in which you buy long the top 2-4 ETFs from SectorCast-ETF, rebalancing either on a fixed schedule (e.g., monthly or quarterly) or when the rankings change significantly. Another alternative is to enhance a position in the SPDR Trust exchange-traded fund (SPY) depending upon your market bias. If you are bullish on the broad market, you can go long the SPY and enhance it with additional long positions in the top-ranked sector ETFs. Conversely, if you are bearish and short (or buy puts on) the SPY, you could also consider shorting the two lowest-ranked sector ETFs to enhance your short bias.
However, if you prefer not to bet on market direction, you could try a market-neutral, long/short trade—that is, go long (or buy call options on) the top-ranked ETFs and short (or buy put options on) the lowest-ranked ETFs. And here’s a more aggressive strategy to consider: You might trade some of the highest and lowest ranked stocks from within those top and bottom-ranked ETFs.

