Courtesy of Scott Martindale, Senior Managing Director, Sabrient

Basic Materials and Energy sectors returned to a leadership role today as the stock market looked to bounce from its recent doldrums. Both sectors advanced about 2%. However, it is Healthcare that has remained consistently strong. And in fact, it is Healthcare that has maintained a steadily strong score in Sabrient’s quantitative SectorCast model.
Overall, the market has been mired in a tug-of-war between the “sell in May” crowd and those who see promising signs for the economy but few good options other than stocks for investment. Today’s market action indicates that the “risk trade” is back in favor. Crude oil closed back above $100 (on a healthy 3% gain), and the dollar is looking like it wants to roll over after steadily rising for most of May.
Today, Dell (DELL) was strong and Hewlett Packard (HPQ) was weak following their earnings reports. This is an example of a great sector “pairs trade,” assuming you were long DELL and short HPQ.
This week, the Federal government hit its $14.29 trillion debt ceiling, which might be sooner than most observers expected. Treasury Secretary Timothy Geithner says he will tap into federal pension funds to keep from defaulting on obligations, and he will suspend investments in the civil service retirement and disability fund, which will effectively give Congress until August 2 to either raise the ceiling or risk defaults. Like the recent Federal Budget battle, there likely will be a last-minute compromise that includes both raising the debt ceiling and some commitment to budgetary concessions.
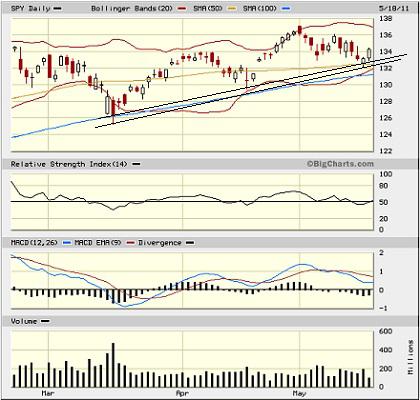
Looking at the SPY chart, we can see that 134 has served as both resistance and support for the past few months, and today it closed back above at $134.36. I have also drawn two rising support lines. The lower line connects the intraday lows since mid-March, and the upper line connects the closing lows. On Tuesday, SPY violated its 50-day moving average during the trading day, but closed above it. And then today it used the 50-day as a launching pad. Also, the 20-day moving average had been providing closing support throughout the month of May until this week, and today’s rally allowed the SPY to close back above it. Furthermore, RSI and MACD are trying to reverse the bearish crossovers that got started on Friday. The chart looks promising but a bit fragile.

The TED spread (i.e., indicator of credit risk in the general economy, measuring the difference between the 3-month T-bill and 3-month LIBOR interest rates) closed at 22.45, which is still relatively low in its range. Fear as measured by the CBOE market volatility index (VIX) closed at 16.23, which is still quite low in its range (it spiked as high as 48 last May). Neither indicator is flashing warning signs.
It is also notable to observe that ETF inflows have been accelerating, with equities favored over fixed income and emerging markets showing a reversal of its previous net outflow. Nevertheless, inverse ETFs are gaining assets as well, as investors show an inclination to hedge their long positions.

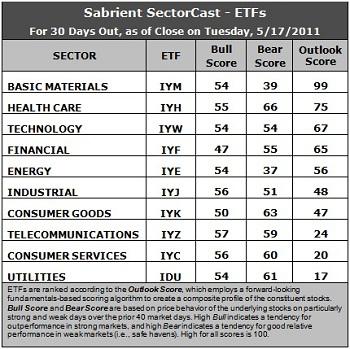
Latest rankings: The table ranks each of the ten U.S. industrial sector iShares (ETFs) by Sabrient’s proprietary Outlook Score, which employs a forward-looking, fundamentals-based, quantitative algorithm to create a bottom-up composite profile of the constituent stocks within the ETF. In addition, the table also shows Sabrient’s proprietary Bull Score and Bear Score for each ETF.
High Bull score indicates that stocks within the ETF have tended recently toward relative outperformance during particularly strong market periods, while a high Bear score indicates that stocks within the ETF have tended to hold up relatively well during particularly weak market periods. Bull and Bear are backward-looking indicators of recent sentiment trend.
As a group, these three scores can be quite helpful for positioning a portfolio for a given set of anticipated market conditions.
Here are some notable observations in this week’s Sabrient’s SectorCast Outlook scores. Keep in mind that they do not reflect valuation changes from today’s market action in which IYM and IYE rallied considerably.
1. Basic Materials (IYM) remains solidly in first place with an incredible Outlook score of 99, as its valuations continue strong in the face of price weakness while analysts reaffirm their projections for stocks in the sector.
2. Healthcare (IYH) holds onto second with a 75. It is solid in most of the model’s factors, with the exception of year-over-year projected growth rate, which is average. We continue to find excellent individual stock plays in this sector.
3. Technology (IYW) strengthened this week, moving up into third place with a 67, as price weakness bolstered valuations and analysts came out with increased estimates.
4. Utilities (IDU) remains at the bottom, and in fact, the gap between the top seven sectors and the bottom three, including Telecommunications (IYZ) and Consumer Services (IYC), remains quite wide. The growth projections for IDU’s constituents are uninspiring.
5. The Outlook rankings continue to reflect a cautiously bullish bent. If Industrial (IYJ) and Consumer Services (IYC) scored a little higher, the overall rankings would be clearly bullish.
Looking at the Bull scores, Telecom (IYZ), Consumer Services (IYC), and Industrial (IYJ) lead, while former favorites Basic Materials (IYM), Energy (IYE), and Technology (IYW) have fallen to the middle of the pack. Financial (IYF) is now the biggest laggard on strong market days.
As for the Bear scores, Healthcare (IYH) and Consumer Goods (IYK) are the clear favorite “safe haven” sectors. Energy (IYE) and Basic Materials (IYM), which led the bull charge, have been the clear laggards on weak market days, reflecting quick abandonment among investors.
Overall, Basic Materials (IYM) still displays the best combination of the three scores, followed closely Healthcare (IYH). And Healthcare (IYH) now has the best combination of Bull/Bear.
Top ranked stocks in Basic Materials and Healthcare include Polypore International (PPO), Kronos Worldwide (KRO), Forest Labs (FRX), and Cigna (CI).
Low ranked stocks in Utilities and Consumer Services include DigitalGlobe Inc. (DGI), National Fuel Gas (NFG), StoneMor Partners (STON), and Sirius XM Radio (SIRI).
These scores represent the view that the Basic Materials and Healthcare sectors may be relatively undervalued overall, while Utilities and Consumer Services sectors may be relatively overvalued, based on our 1-3 month forward look.
Disclosure: Author has no positions in stocks or ETFs mentioned.
About SectorCast: Rankings are based on Sabrient’s SectorCast model, which builds a composite profile of each equity ETF based on bottom-up scoring of the constituent stocks. The Outlook Score employs a fundamentals-based multi-factor approach considering forward valuation, earnings growth prospects, Wall Street analysts’ consensus revisions, accounting practices, and various return ratios. It has tested to be highly predictive for identifying the best (most undervalued) and worst (most overvalued) sectors, with a one-month forward look.
Bull Score and Bear Score are based on the price behavior of the underlying stocks on particularly strong and weak days during the prior 40 market days. They reflect investor sentiment toward the stocks (on a relative basis) as either aggressive plays or safe havens. So, a high Bull score indicates that stocks within the ETF have tended recently toward relative outperformance during particularly strong market periods, while a high Bear score indicates that stocks within the ETF have tended to hold up relatively well during particularly weak market periods.
Thus, ETFs with high Bull scores generally perform better when the market is hot, ETFs with high Bear scores generally perform better when the market is weak, and ETFs with high Outlook scores generally perform well over time in various market conditions.
Of course, each ETF has a unique set of constituent stocks, so the sectors represented will score differently depending upon which set of ETFs is used. For Sector Detector, I use ten iShares ETFs representing the major U.S. business sectors.
About Trading Strategies: There are various ways to trade these rankings. First, you might run a sector rotation strategy in which you buy long the top 2-4 ETFs from SectorCast-ETF, rebalancing either on a fixed schedule (e.g., monthly or quarterly) or when the rankings change significantly. Another alternative is to enhance a position in the SPDR Trust exchange-traded fund (SPY) depending upon your market bias. If you are bullish on the broad market, you can go long the SPY and enhance it with additional long positions in the top-ranked sector ETFs. Conversely, if you are bearish and short (or buy puts on) the SPY, you could also consider shorting the two lowest-ranked sector ETFs to enhance your short bias.
However, if you prefer not to bet on market direction, you could try a market-neutral, long/short trade—that is, go long (or buy call options on) the top-ranked ETFs and short (or buy put options on) the lowest-ranked ETFs. And here’s a more aggressive strategy to consider: You might trade some of the highest and lowest ranked stocks from within those top and bottom-ranked ETFs, such as the ones I identify above.

