 … properly, or at least ‘better’.
In the past I have provided ranked lists of journals in conservation ecology according to their ISI® Impact Factor (see lists for 2008, 2009, 2010, 2011, 2012 & 2013). These lists have proven to be exceedingly popular.
Why are journal metrics and the rankings they imply so in-demand? Despite many people loathing the entire concept of citation-based journal metrics, we scientists, our administrators, granting agencies, award committees and promotion panellists use them with such merciless frequency that our academic fates are intimately bound to the ‘quality’ of the journals in which we publish.
Human beings love to rank themselves and others, the things they make, and the institutions to which they belong, so it’s a natural expectation that scientific journals are ranked as well.
I’m certainly not the first to suggest that journal quality cannot be fully captured by some formulation of the number of citations its papers receive; ‘quality’ is an elusive characteristic that includes inter alia things like speed of publication, fairness of the review process, prevalence of gate-keeping, reputation of the editors, writing style, within-discipline reputation, longevity, cost, specialisation, open-access options and even its ‘look’.
It would be impossible to include all of these aspects into a single ‘quality’ metric, although one could conceivably rank journals according to one or several of those features. ‘Reputation’ is perhaps the most quantitative characteristic when measured as citations, so we academics have chosen the lowest-hanging fruit and built our quality-ranking universe around them, for better or worse.
I was never really satisfied with metrics like black-box Impact Factors, so when I started discovering other ways to express the citation performance of the journals to which I regularly submit papers, I became a little more interested in the field of bibliometrics.
In 2014 I wrote a post about what I thought was a fairer way to judge peer-reviewed journal ‘quality’ than the default option of relying solely on ISI® Impact Factors. I was particularly interested in why the new kid on the block — Google Scholar Metrics — gave at times rather wildly different ranks of the journals in which I was interested.
So I came up with a simple mean ranking method to get some idea of the relative citation-based ‘quality’ of these journals.
It was a bit of a laugh, really, but my long-time collaborator, Barry Brook, suggested that I formalise the approach and include a wider array of citation-based metrics in the mean ranks.
Because Barry’s ideas are usually rather good, I followed his advice and together we constructed a more comprehensive, although still decidedly simple, approach to estimate the relative ranks of journals from any selection one would care to cobble together. In this case, however, we also included a rank-placement resampler to estimate the uncertainty associated with each rank.
I’m pleased to announce that the ‘final’ version1 of that analysis will be published soon in PLoS One2.
Without going into too much detail (you can read all about it in our paper), our approach took five of the most well-known, least inter-correlated and easily accessible citation-based metrics (Impact Factor, Immediacy Index, Google Scholar 5-year h-index, Source-Normalised Impact per Paper & SCImago Journal Rank), ranked them, then calculated the mean rank per journal.
We also implemented a resampling approach that provides the uncertainty of each journal’s rank within the sample.
My use of the terms relative and within the sample are important here — journal metrics should only ever be considered as indices of relative, average-citation performance from within a discipline-specific or personally selected sample of journals. By itself, the value of a particular journal citation metric is largely meaningless.
As example lists, we looked at 100 Ecology, 100 Medicine and 50 Multidisciplinary journals and applied our ranking method. We also include some samples of highly specialised-discipline journals in Marine Biology & Fisheries and Obstetrics & Gynaecology. All these ranks were based on 2013 metric values (because the 2014 values had not yet been released when I started the analysis).
We even provided the results of a small survey I ran last year to find out what ecologists thought of particular journals (many belated thanks to all who participated). I wanted to get more to the heart of the ‘reputation’ idea and compare this to the combined ranks3. It turns out that the correlation between what we think about journals and their composite citation-based ranks is pretty good (Spearman’s ρ = 0.67-0.83). However, the deviations from the rank expectations are probably more interesting (see Fig. 2B in the new paper).
I know what you’re thinking though — “Hey Corey, what are the journal ranks in conservation & ecology based on the 2014 metrics?”. Despite you being able to do this by going online and getting the values yourself, and using the R script we provided with the paper, I know most of you couldn’t be arsed to do it.
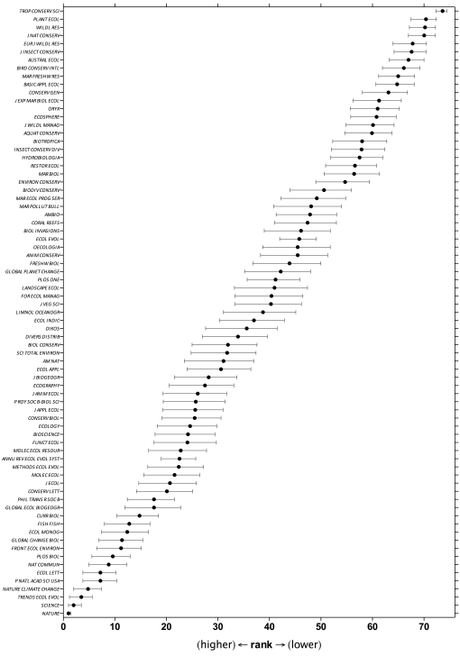
So I’ve taken the liberty of ranking journals from a mixed list of ecology, conservation and multidisciplinary disciplines that most likely cover the gamut of venues the CB.com readership might be interested in (you can download the raw data here). I make no claims that this list is comprehensive or representative, so if you don’t like my choices or want to include different journals, you’ll just have to do it yourself.

Now, a long list like that sort of goes against the philosophy of ranking journals in the first place. Ideally, the list should be a lot smaller so that the relative ranks start to make sense at a practical level.
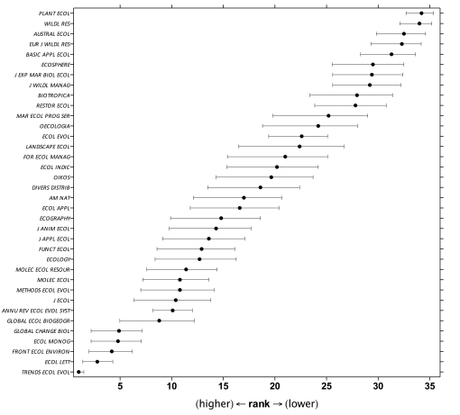
For example, here is the ranking of 36 Ecology-only journals from that larger list (again, this is not comprehensive):

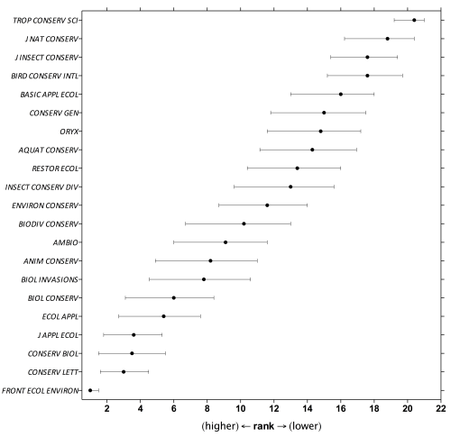
And here is the ranking for 21 Conservation-only journals (you might quibble with what I call ‘conservation-only’ here):

While these are informative, they still don’t really represent the kind of information I think I need when deciding where to send a manuscript. You can, of course, compile any list of journals you want, but below I provide two more example sets.
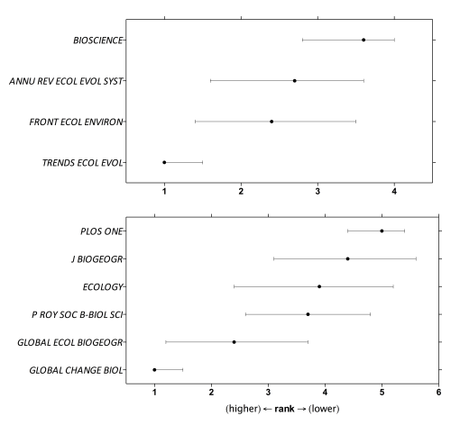
The top panel of the figure below shows the relative ranking of four ‘review’ journals in ecology/conservation. The bottom panel shows six journals where one might consider sending a manuscript with a ‘biogeography’ theme (I threw PLoS One in there as a multidisciplinary back-up option).

I think you get the picture of what sort of things you can do with the new method, and of course, it’s not limited to any particular field at all. So, go crazy! Get your own lists together and start ranking!
—
1I don’t normally release pre-prints for blog posts, but given that (i) the paper will be published soon in an open-access journal, (ii) I’ve already paid the open-access fee (way to bloody high, in my opinion), and (iii) Nature recently reported that scientists should be more inclined to post pre-prints, I said “fuck it” and decided to release it early.
2I hope the irony of the publishing venue didn’t escape you. PLoS One ranked consistently low in nearly all sample journal lists we analysed. The reason Google Scholar’s h-index ranks it so highly is because that metric is inflated by high publication output (i.e., many papers produced annually). Once you control for this, the h-index drops to be more in line with PLoS One‘s Impact Factor.
3I fully admit that there is some circularity here; people are subconsciously influenced by citation-based metrics already.
CJA Bradshaw

