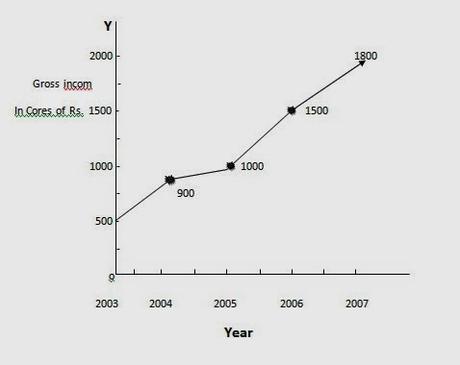
 IMPORTANCE OF TREND ANALYSISTrend analysis occupies an important place in the financial analysis of the financial statements due to the following merits.
- Comparative Study: -The trend analysis is of immense help in comparative study of different from the point of view of forecasting and budget.
- Brevity and Readability: -The method of trend analysis is useful for the management and also the common man since by substitution of percentage for large amounts the brevity and readability are achieved.
- Direction of Changes: - The trend clearly reflects the increase or decrease in the various facts of business from the past to the present or from the year to year. The direction of change can be even more clearly represented by graphs and diagrams, where the change can be noted even with glimpse.
- Easy to Understand and Easy to Calculate: -The method of analysis and the results obtained can be easily understood by common man. Moreover, the calculations are not complex as trend percentage or ratios can be easily calculated by dividing the current year’s figure by the base years figure and multiplied by 100.this is a method which is appropriate in calculating various index numbers.
- Fewer Chances of Errors: - There is Less Chances of errors under this method, because results obtained by percentage changes of data can be compared with absolute changes.
LIMITATIONS OF TREND ANALYSISAnalyzing the financial statement through trend percentages and trend ratios, the following limitations must be taken into consideration:-
- No Significance of Single Percentage or Ratio: -The trend Ratios and percentage of a single item has no significance in itself. We can arrive at some meaningful and useful conclusion only when the trend of one item is compared with the trend ratio of other related item. To illustrate an increasing trend in the value of stock is meaning-less unless it is compared with a trend in sales. Thus, it is essential that ratios of logically related items should also be calculated and put side by side for easy comparison and for drawing some conclusions.
- Illogical and Misleading Conclusions: - The inferences drawn on the basis of simply trend ratios, without keeping in view the original absolute figures may be sometimes illogical and misleading. It is essential to study the original data along with trend ratios.
- Unscientific and Inconsistent: - The comparison of trend ratio may be unscientific and inconsistent if principles and practices followed were not kept uniform and consistent throughout the period of analysis. It is necessary that the accounting policies and practices are not changed throughout the period. The and then comparison can be realistic

