Ever wondered what the heck a “session” or “pageview” is, or what “bounce rate” really means?
In this post I want to explain a little more about each of the Key Metrics presented by Google Analytics, and more importantly how you can begin to use that data to shape your website for growth.
Before you begin it is important to have installed Google Analytics on your website, be that WordPress or Another CMS.

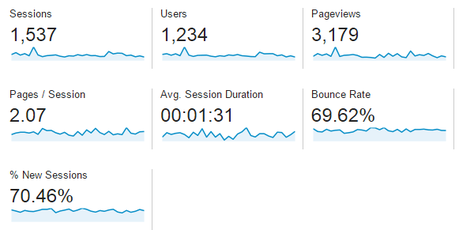
Example of Key Metric Data from Google Analytics
Before we dive into how we can use the data, let’s take a moment to understand what each metric (from the main dashboard) tells us.
Google Analytics – Jargon Buster
Sessions (formerly Visits)
This tells you the total number of times your website has been visited, by both new and returning visitors over the given period. It gives you a good overview of how in general your website is doing.
Users (formerly Visitors)
This metric is simply the total number of unique visitors to your website, this is count increments based on each time a new visitor comes to your site. Comparing this to “sessions” will tell you the number of returning visits.
Pageviews
This is simply the total number of pageloads by users, within your site in the given period, for both new and returning users.
Pages / Sessions
This metric gives you the average number of pages visited per session. Put simply it is the number of page views divided by the number of sessions. Ultimately the ideal for this varies from around 2 or 7, depends on the basis and content of your website. E-commerce will tend to have a much higher number.
Avg. Session Duration
This simply tells you how long the average stay on your website is, it is useful for spotting any problems within your website occurring. If this suddenly increases, you either have a long video on the site everyone loves or visitors are getting stuck somewhere.
Bounce Rate
Bounce rate is the percentage of visits in which users view only a single page of your site. The caveat is that there is also a time function to the %, this means if you have a long page but someone only visits one page and spends 5 minutes there it does not count as a bounce.
% New Sessions
This metric serves to highlight how much of your traffic is new compared to returning. Depending on your type of website this figure may be great when high (eg if you sell a niche service) or you would prefer it to be lower (eg if you are selling products you want people to buy each week or month).
Finding Your Way Around Google Analytics
Now you’ve an understand of what some of the basic metrics mean, it’s time to have a look around Google Analytics.
In this section I want you to understand a little more about what each “dashboard” view shows and what it can be used for.
Note: I will in future posts return to the most important dashboards to show you how to get the most from them.

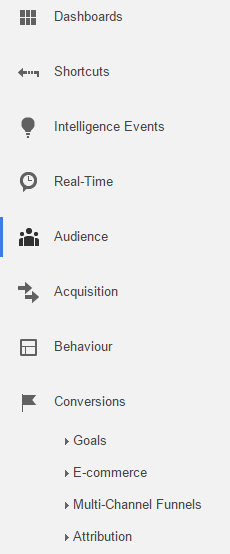
The navigation, recently simplified, is pretty easy to use. Whats in each section?
Dashboard
In this section you will find your primary reporting dashboard and any other dashboards you create, we’ll come back to this in a later post.
Shortcuts
You will find here a list of your most visited reports and dashboards, you will need to have been using GA for a few weeks before it becomes active.
Intelligence Events
This is where Google will great you a bunch of default alerts based on what it knows about your site to give you some more detail. It’s really handy. It basically is about taking metrics, such as those above, and giving you a comparative view, by default it will choose what GA see’s as the best comparison period.
Real-Time
This gives you some cool information about what is currently happening on your website, which pages are in use and the sources of your traffic. You can also see the conversions and events tracked on your site. It really is a real-time as you can only generally see upto 30 minutes previously. This data doesn’t immediately move through to your standard GA views, this can take hours or even a day.
Audience (formerly Visitors)
In this section you will be able to find information on metrics such as Demographics, Location, Device Type, Browser Usage and Engagement levels. Depending on your type of website this can be VERY important information, in particular location and device usage.
Acquisition
As the name would suggest this section is where you will learn where a user has come from before visiting your website, how certain channels perform for traffic and even how particular users from a given channel behave within your website.
Behaviour
This part of Google Analytics is about what the user does within your site, you can see a ton of things including: landing pages, exist pages, top content, website events and much more. It is typically the main hub of information.
Conversions
Every website has a conversion, even if its just reading another blog post. This section is all about measuring those conversions, events and of course your sales.
Take Action
At each stage of this series about Google Analytics, I want you to take action. Each action, although some may be small, will help build your confidence in using Google Analytics but also enable you to explore and ask questions. Today’s action is…
Complete the Setup of Google Analytics on Your Website and To Explore the Google Analytics Interface.
Original SEO Content by SEOAndy @ Google Analytics – Understanding the Basics

